|
By Elijah Humphries
Student in Community GIS, Spring 2022 When discussing topics of racial justice, generational wealth is a topic of utmost importance, and land ownership specifically is well explored. The “land as liberation” ideal and the historical factors surrounding different movements towards and away from the accumulation of generational wealth in the form of land ownership for the African American population in the South has been tested by various movements. For example, Fannie Lou Hamer’s Freedom Farms sought to return land to Black people in the South and achieve a level of autonomy and independence from a political and economic system that shamelessly segregated and disadvantaged them. But the benefits of land ownership are multiplicative. A landowner gains a larger stake in their community and the ability to slowly build that wealth, then pass it on to their children. By 2021, 27% of American wealth was in the hands of the top 1.0% of the population, this gap has only grown since then, and about 40% of wealth in the US is inherited (Source). So when we consider how, despite movements to fix the divide, generations of African Americans were denied the ability to buy and own land, there’s a clearly forced inequality in that sphere which allows people to build generational wealth. It was intentional, too. The Housing Act of 1949 cleared the way, quite literally, for a clean sweeping of the urban poor, because it allowed governments to do away with poor or substandard housing in urban areas, called urban renewal, as more affluent citizens moved to the suburbs. With the advent of urban renewal projects, governmental officials had the toolset to clear “blighted” or “dilapidated” areas in their jurisdictions, but these overwhelmingly targeted Black populations and other minority groups. In more recent years, urban renewal practices are viewed as discriminatory across the board. The U.S. Commission on Civil Rights published a briefing report in 2014 titled The Civil Rights Implications of Eminent Domain Abuse, which analyzed two Supreme Court cases, Berman v. Parker and Kelo v. City of New London, looking at the decisions, critiques, and several studies and briefings that identified cases of eminent domain abuse and its effect on poor and minority communities and how that might be interconnected with civil rights. The report noted a 2007 study titled Victimizing the Vulnerable: The Demographics of Eminent Domain Abuse which found a disproportionate impact on communities with the least power: “more residents in areas targeted by eminent domain-as compared to those in surrounding communities-are ethnic or racial minorities, have completed significantly less education, live on significantly less income, and significantly more of them live at or below the federal poverty line. Here in Athens, one such area was Linnentown, a neighborhood adjacent to the University of Georgia campus. Starting in the 1950s, the University and the City of Athens began making moves to condemn land so that the University could expand. The University of Georgia campus was almost entirely surrounded by residential properties, and had plenty of land to look at for expansion, including through buying it at a fair price, but instead worked to have the Linnentown residents forcefully removed from their homes. First, by making it a completely unsafe place to live, and followed by more aggressive measures, until they were told that they simply could not live in their own homes anymore, that they had been bought by the University at a pittance, and that they would have to find new places to stay. The University refuses to acknowledge its role in these proceedings, or that it participated in what is widely known to be racially discriminatory practices for its own benefit. As students, and people interested in doing what is best for our community, we should keep pushing for recognition and reparation. Our class is working to create more recognition for the people who seek to right these wrongs. By offering our time and capacity as students, we help put together marketable information that will help more people understand what the University and the City did, and why those actions were detestable and worthy of condemnation. As more and more of the information we consume is transferred over a digital medium, it becomes more important to make history more accessible and clear to others. By contextualizing and narrating the circumstances and proceedings of the urban renewal project that destroyed Linnentown, we bring the issue back to the attention of our peers and contemporaries. I’ve been working on a storymap, a web page that allows anyone to scroll through a narrative experience curated by myself and the rest of the class, that will display much of the information surrounding both the historical events and the contemporary actions we and others have taken.
0 Comments
By Claudia White Community GIS student and CML research assistant, Spring 2022 This semester, I am taking Community GIS with Dr. Shannon and working with the Community Mapping Lab on various projects, including creating a StoryMap of Linnentown (a Black residential community in Athens displaced by urban removal in the 1960s), digitizing a street network, geocoding addresses, and cleaning data records from a 1958 Athens directory. One of our assignments was to create a map using the 1958 Athens directory and the street network that we digitized. The city directory included a listing of residents, businesses, and organizations in 1958 and their addresses. Data on residents included several variables, such as occupation, race, the number of dependents, home ownership status. Using the address data and resident data, I decided to create a map about the commute time of maids to look at patterns of travel (time, length, etc.) clustering of living vs working addresses. The current map is hosted on ArcGIS Online, but I first tried to make it in ArcGIS Pro. Here be the practical things I have learned while making this map. 1) Creating Maps for the Public There are a million tiny decisions to make when creating maps from scratch. Creating visualizations for yourself is one thing, but creating maps for the general public is another. When creating maps for others, make sure you are creating visuals that are both easy to understand and easy to look at. Keeping design principles in mind is key. My first map draft had colors that were difficult to distinguish, lines that were hard to separate from the background streets, and symbols that were too small to see (Figure 1).  Figure 1 With Dr. Shannon’s help, I thought about figure-ground, visual contrast, and legibility. To make the map easier to read, I made the background road network more transparent, set route colors to very contrasting colors and put a drop shadow on the routes to make them more discernible from each other and the background. I also made the symbols larger so they were more visible. I then made each maid’s route, living, and working address the same color, so that the viewer could easily see which route and addresses corresponded with each maid (Figure 2).  Figure 2 2) ArcGIS Pro a) Use snap when digitizing in ArcGIS Pro. Digitizing images in any GIS software can be tedious, but if you are using ArcGIS to turn an image into features. I highly recommend using the “snap” setting. Turning on snap allows you to minimize topological errors as you digitize (making sure your lines meet up and your polygons are closed. This setting was very helpful when digitizing the 1955 street network for Athens. It made sure that I only created lines that connected to a point on another existing street line. You can turn the snap setting on and off through the dashboard. b) Depots are origins and orders are destinations. When creating a driving route in ArcGIS Pro using street networks, you can use the Make Vehicle Routing Problem Analysis Layer. This function will only create a network analysis layer. After creating the layer, you then have to input points that you want to be used to create routes within the network analysis layer. When using sets of origin and destination points (ex: if you want to calculate your commute from your home address to your working address), it is important to note that “depots” are origin points and “orders” are destination points. c) You can create tiles from raster data using the Create Map Tile Package. This function uses data from a map pane and compresses it into a tile package that can be used in ArcGIS Online. Make sure the only data on your map pane is the data that you want to tile. Before using this function, you have to add a description, summary, and tags to the data that you are tiling. You must then input the corresponding summary and tags into the geoprocessing pane for the Create Map Tile Package function. d) You can share map layers as Web Layers for ArcGIS Online. If you right click on a layer in your map, you can share that layer as an online web layer that can be used in ArcGIS Online. This tool can be used on raster and vector data. You must add a summary and tag(s) of the layer. Once you share the layer as a web layer, the layer is automatically uploaded to your ArcGIS Online content and can be opened, viewed, and stylized in ArcGIS Online. This is particularly useful if you have styled a layer in a particular way because it maintains the layer’s symbology. 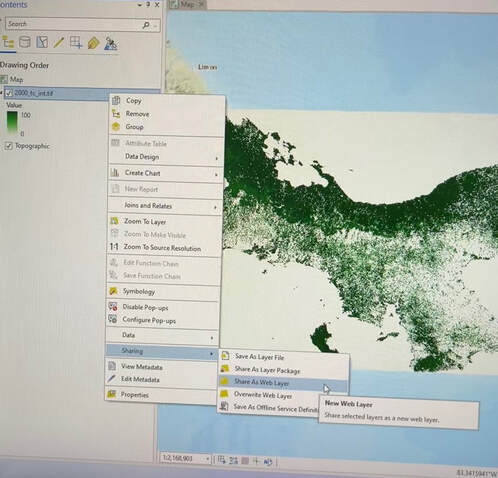 Figure 3 3) ArcGIS Online
a) Map Viewer Classic is picky about data users can upload. When using ArcGIS Online to create a map based on the 1958 Athens directory for this class, I learned that ArcGIS online only accepts certain types of data. In Map Viewer Classic, users can only upload a zipped shapefile, CSV or TXT files, GPX, or GEOJSON files from their files. Of course, users can also use data that is hosted by ArcGIS Online, but the types of data the user can add and manipulate is limited. b) Map Viewer Classic vs New Map Viewer: Uploading data In Map Viewer Classic, users are able to add data directly from a file. In the new Map Viewer, users have to jump through a couple more hoops. When using the new viewer, users must first upload their data from file to their content page in ArcGIS Online. When uploading data, you should check the box that adds the desired file AND creates a hosted feature layer. This ensures that you will be able to easily add uploaded data to the map viewer. c) It does not like raster data. ArcGIS Online is not a fan of raster data and is not compatible with tiff files. If you are using raster data, first look for any datasets that are already hosted on ArcGIS Online that display the information you are looking for. If you can’t find desired data and must upload an original raster dataset, the best way to do this is by converting your raster data set to tiles and then uploading the tiles to ArcGIS Online. Final thoughts In creating this map, I learned technical skills related to using different analysis toolboxes in ArcGIS Pro. I also learned how to navigate bounds of ArcGIS online. Most importantly I learned what factors to consider when creating maps for a public audience, including color contrast, symbology, and clear labeling. These skills will help me create more accessible and intuitive visualizations in the future. By Bryant Beall
Student in Community GIS, Spring 2022 I am currently taking a class called Community GIS. Community GIS teaches how GIS is used to research by local agencies, and community groups. In Community GIS we have mainly focused on a small former community in Athens called Linnentown. I always really enjoy learning more about local history because it can help explain why things the way they are today. History is even more interesting to me when it involves people or organizations that I know of or are physically close to. This is partly why I have found our study of Linnentown to be so encapsulating. Linnentown was a historically black neighborhood off of Baxter Street near the campus. In the 1960’s Linnentown was demolished by the University of Georgia so that they could build the dorms. The residents of Linnentown were forced to leave their homes and community as the University slowly acquired all plots of land through eminent domain or private sales. Residents were forced to leave their communities that they had lived with and trusted some for generations. In class one of our required readings was from a book titled Giving Voice to Linnentown. This was a story of what it was like to live in Linnentown from the point of view of a former resident Hattie Thomas Whitehead. This personal account struck me hard because it shows the fears and experiences that someone had when they were told they have to leave their community. She tells a story that the university had bought the land that their rented house was on so they bought a different Linnentown plot and built a house on it. The city approved the construction and said they would add plumbing to the house, but they never did. Soon after, the rest of Linnentown was acquired by the University, even the new house. The city knew that this land would soon be owned by the university, so that raises the question. Why did the city approve of this construction and waste this families time and money when they knew the whole time that it would soon be university property? After learning about this story I could not help but feel shameful about the school that I love. I love this city and I love this school but it makes me feel very sad to think about some of the extreme wrong doings done that they are responsible for. I wish that the University of Georgia would acknowledge what happened and issue an apology or do anything about this situation. I know a statement could never fix what they did and the families they uprooted, but it is at least a start and better than ignoring the blame like they are currently doing. In my Community GIS class we are currently working on a story map project covering the history of Linnentown. My hope is that when people come across this story map they will not only be informed of Linnentown and the hardships its residents experienced, but that it will inspire people to speak up and raise awareness for Linnentown and other communities that underwent urban renewal projects. |
Archives
March 2024
Categories
All
|

- Home
- About
- Activties
-
Projects
- Athens Wellbeing Project
- ACC Black-owned businesses
- Athens bike routes
- Atlanta Community Food Bank
- Athens 1958 City Directory
- Athens bike routes
- Brooklyn Cemetery
- Evictions in Athens
- GA Hunger study: Proximity map
- Georgia Initiative for Community Housing
- Historic Cobbham Neighborhood
- Hot Corner
- Linnentown
- Sparrow's Nest
- Blog
- Resources
- Calendar
 RSS Feed