|
By Margaret Hersey, Community GIS student Spring 2023
The Community GIS course functions similarly to other GIS courses by strengthening students’ technical skills in popular software such as ArcGIS Pro, QGis, and ArcGIS online. However, the scope extends far beyond the glowing monitors and classroom walls. During this course students are given the rare opportunity to step out of the classroom and collaborate in meaningful and equitable partnerships for community-based research. Our course instructor (Dr.Shannon) provides students with theoretical frameworks that illustrate the context in which we work with the community and enable us to work collaboratively and meaningfully towards community empowerment. Topics include Critical GIS, situated mapping, community geography, and counter-mapping. This semester we focused on two projects, each involving members of the Athens-Clarke county community. For the second half of the semester, our class worked with the Athen’s Housing Advocacy Team (AHAT), whose goal is to empower the tenants of Athens-Clarke county to fight for housing justice by providing access to information and resources. Rather than simply documenting evictions, they actively challenge inequalities and the processes that produce them, leveraging maps to draw attention to and alter public perception of evictions within Athens, Georgia. AHAT team members spoke with our class and shared their experiences working with Athen-Clarke County tenants. Their willingness to share these experiences allowed us to gain new perspectives of social and spatial inequalities within Athens that an ‘objective’ map alone could not. We learned that AHAT emerged shortly after the COVID-19 pandemic, following mass evictions of immigrant communities within Athens-Clarke County. Three years later, in 2023, many community members are still dealing with financial instability and economic hardships caused by the pandemic–now, without the protection of the CDC’s eviction moratorium (An order that allowed additional time for rent relief and prevented persons from being evicted from their homes). In addition to COVID, the county has faced increased housing demands due to an influx of students enrolling in the town's local college, the University of Georgia. The university has, on average since 2014, admitted 625 additional students per year– and doesn’t show signs of slowing anytime soon. Despite this, the university has only built one dormitory since 2014– causing many students to seek housing off-campus and compete for homes with permanent residents. The community has seen drastic rent increases followed by the displacement of community members who cannot accommodate the rising prices. In recent years real estate companies have responded to this growing student market. One of these companies– Prosperity Capital Partners, purchased hundreds of working-class units in lower-income areas of Athens-Clarke County to renovate and sell at a higher price point. In some cases, they increased rent by as much as 93%. Many residents also received a 30-day notice to vacate their properties– a violation of Georgia law. Breaches like these are not uncommon in eviction cases, and AHAT aims to identify those violations and equip tenants to handle them through resources like their eviction defense manual. The eviction manual is designed to inform tenants of their rights and gives a brief walk-through of the eviction process. Our Community GIS class worked together to identify what questions we could answer with the data we had. From there, we decided which of those questions were the most relevant, helpful, and feasible. Feasibility was a factor since we had only two weeks to work on the projects. Each group was then given a topic that focused on either landlords, tenants, or the Athens Eviction Prevention Program. One group mapped how housing stress affected eviction patterns, while another worked on determining the cause behind most evictions and the average eviction timeline in Athens. My group examined the distribution of landlords at local and global scales, choosing to map the locations of landlords who own the most properties and landlords with the highest number of evictions. First, we filtered the Athens-Clarke County parcel zoning data to find parcels in residential zones without homestead exemptions. To be granted a homestead exemption, a person must occupy the home, which is considered their legal residence. So parcels without homestead exemptions were considered rental properties. For each remaining parcel, we obtained the owner's address and the number of properties they owned in Athens, Georgia. We then joined this dataset to our ArcGIS project and geocoded all owner addresses. We used a visualization technique referenced by Taylor Shelton in his article, “Situated Mapping: Visualizing Urban Inequality Between the God Trick and Strategic Positivism.” Using flow maps, Shelton mapped the relational geographies of vacant and abandoned properties in Louisville, Kentucky. We used flow mapping and proportional symbology to visualize the connection between landlord and tenant locations. Understanding the distribution of landlords can provide insight into housing and help inform decisions for zoning, housing policies, and rent control. It can also provide a source for future researchers to draw from.
0 Comments
By Maya Henderson, Community GIS student in Spring 2023
My driving goal is to be of service to my community, Native nation, and broader Indian Country. Sometimes, however, I struggle to see how obtaining my PhD in Geography so far from home and at a university with limited support for Indigenous students is helping me achieve that foundational goal. I often find myself in this headspace when my coursework and tasks as a PhD student aren’t aligning with my areas of interest and values as a Seneca-Cayuga person and scholar. This semester Community GIS has helped me to recenter me, reminding me why the skills, tools, and knowledge I am obtaining here in Geography at UGA are still in line with my driving goal. I say this for two reasons, the skill sets I am gaining through the course and the involvement and direct aid to the local community. Community engaged scholarship and GIS are skill sets that I can directly employ to be of service to my community. These methodological and technical mapping skills are highly sought after and needed by Native communities and nations. Spatial analysis and more specifically GIS are becoming increasingly used by Native nations for projects including but not limited to land use planning, environmental and sustainability projects, and jurisdiction and political purposes. Since Native nations and communities are employing spatial analysis for community and nation-building projects this has also led to outside partnerships. This often means working with non-Native partners, a reality that although can be fruitful, can also add to the precarity of the Native nation and community. I see Community GIS as allowing me to craft the skills needed to be a Native academic partner for Indian Country. One key reason for precarity concerns when working with non-Native partners is the data required on Native nations and communities for spatial analysis projects. Here the principles of Indigenous data sovereignty and trust become key. Data collection and analysis has always existed within Indigenous communities but data collection and open data under the settler colonial structure in which we live can increase rather than decrease Indigenous precarity. By this I mean that while data can aid Native nation’s sovereignty and goals it also “sits at the nexus of current and historic data challenges as a result of colonisation, bias, and a lack of knowledge of Indigenous rights” (Rainie et al. 2019). It is for this reason that I, as an Indigenous person who is part of Indian Country and accountable to my people, wants to develop these community GIS skills. Our nations and communities can and do benefit from spatial data and its analysis but because of its precarious potential, keeping Indigenous data in Indigenous hands is equally important. Although the Community GIS course has not touched on the idea of data sovereignty explicitly, there has been an iterative process of reflection and intentional decision-making regarding the data we obtain, clean, use, and store. One keyway that I have seen the tenant of data sovereignty in the course is through discussion of data access, storage, and ownership. For one project regarding the historic Black cemetery in Athens, GA we discussed at length where the data should be stored and who could host and gain permanent access. After reviewing accessibility and stability concerns, we decided upon google drive with the community mapping lab rather than a single person hosting the data and permanent access shared with the board members of the cemetery. Carefully considering accessibility, location of data, digital access, and more are essential steps and principles of data sovereignty in the context of community engagement, and I consider them necessary skills, just like those of geocoding and physical map creation. Engaging in these discussions allowed me to draw on what I know of Indigenous data sovereignty and begin to see how data sovereignty tenants can be applied more broadly in community projects. In addition to teaching me necessary skills, Community GIS allowed me to become more grounded in the local community and space where I am living as a guest while I obtain my PhD. Although I aim to always be accountable to my community back home and Indian Country overall, my protocol and teachings as a Seneca-Cayuga woman remind me of my responsibility to be a good guest. By this I mean that I am responsible to and for those around me. Being a PhD student means that I am constantly overscheduled, and it can become hard to find time to engage in community efforts outside the academy. Therefore, Dr. Shannon’s Community GIS course is uniquely situated to aid students, undergraduate and graduate, in becoming more grounded in Athens. The course teaches us about the historical-present of Athens, GA and allows us to meet community members and organizers that we likely wouldn’t otherwise through the various projects we work on in class. For example, working on the eviction mapping project we got to speak with former County Commissioners, City of Athens GIS employees, and engage with representatives of community groups like the Athens Housing Advocacy Team. In doing this we learned more about how the local government operates, the housing landscape of Athens, and what can be done using GIS to aid the community. One project that taught technical and community geography skills alongside place-based histories and present was the Brooklyn Cemetery Project. Working with members of the Black community in Athens on restoring and mapping their cemetery, Brooklyn Cemetery, was particularly impactful for me in regard to engaging my traditional protocol in the Athens context. As an Indigenous person, I am taught deep reverence for our ancestors and the sacredness of their burial grounds. Therefore, it was particularly meaningful for me to be able to aid the Black community here in Athens in mapping their cemetery. The most powerful moment of that project was being able to locate one community member's grandparents in the cemetery using the searchable web map created in the class. Although I am not part of that community and those buried in Brooklyn Cemetery are not my ancestors, I was doing right by my people here in Georgia by aiding the local community in this way. Reflecting on the Community GIS course has helped me recenter my purpose here at UGA. It reminded me that obtaining my PhD is allowing me to create and sharpen many tools that my Native nation and broader Indian Country need and want for our people to have for ourselves. The projects we’ve engaged with this semester, like Brooklyn Cemetery and eviction mapping, have also reinforced the ways that I can be accountable to my people while being far from home. Citations Rainie, S. C., Kukutai, T., Walter, M., Figueroa-Rodriguez, O. L., Walker, J., & Axelsson, P. (1970, January 1). Issues in open data. Indigenous Data Sovereignty. Retrieved April 30, 2023, from https://www.stateofopendata.od4d.net/chapters/issues/indigenous-data.html By Jai'anna Gonzales, Community GIS student in Spring 2023
I decided to take Community GIS for a few reasons. The first is to have the opportunity to work on a project where the data is not neat and prepared for you and has real-world implications. The second is to have more experience in community engaged work, particularly because I have an interest in urban planning. The third is because I knew about the work the Community Mapping Lab did with Linnentown and it opened my eyes to the power of mapping. Situated mapping is a concept introduced to our class through a research article by Taylor Shelton, who came to speak to us about his paper this semester. It was an enlightening conversation about how we can approach mapping from a more complex viewpoint. In this paper, Shelton argues that we can “simultaneously use maps to prove that inequality exists…while also demonstrating that the ways we conventionally think about space through maps are not really sufficient to understand what is actually going on in the world” (Shelton, 2021). The world typically views maps as a quantitative and authoritative method of constructing knowledge. Being able to use GIS beyond these conventional goals and implementing more qualitative and subjective ways of mapping is a useful way to shift the ways we view the world around us, and this has certainly shifted the ways I think about GIS work. For example, another article we read this semester was about anti-eviction mapping in San Francisco, where personal stories, community art, and subjectivity were incorporated into mapping efforts. Instead of simply mapping where evictions occurred, Manissa Maharawal, Erin McElroy, and community members worked to create maps and stories with the intention of making the marginalized visible and challenging the processes that forced people out their homes. These efforts were in direct service to community action and advocacy (Maharawal & McElroy, 2017). Instead of viewing mapping/ GIS as simply a means to an end for tracking an event or occurrence, I can now see how mapping for a specific situation or viewpoint can create maps for action instead of just knowledge. Maps that are about people, not datapoints. This is the framework we established before diving into our work with evictions in Athens. The second half of this spring semester we have been working with eviction data collected by The Athens Housing Advocacy Team, AHAT. We spent the first few weeks getting familiar with the data, other possible data/information sources, the specifics of EPP (an eviction relief program run by the city of Athens) and how it was run, and how our work fits into a larger context of community-engaged mapping. We have broken into groups to address key research questions about the eviction landscape such as: Who is doing the most evicting? Where are landlords located? Who benefitted from EPP? What are the demographics of the communities facing the most evictions? I am on the “categorizing landlords” team, where we are trying to determine how to categorize landlords by number of properties, eviction filings, eviction outcomes, and see how these categories compare. Once it was time to dig in, our team got caught up in the details quickly, so I want to take a moment to reflect on how our work contributes to the concept of situated mapping. By focusing on mapping and understanding landlords instead of tenants, we are attempting to aim the conversation surrounding evictions on those pushing forward the processes of dispossession. Through this project we were able to identify the landlords in Athens filing the most evictions and gather information about their eviction behavior, such as how many filings resulted in evictions. Instead of simply asking ourselves where the evictions are happening, we have tried mapping for action. AHAT and those facing housing stress can reference this data about landlords when deciding the best avenues for advocating for tenants’ rights. Learning critical cartography as a UGA student also provides a better understanding of what exactly our situatedness as students entails. We have access to resources that allow us to help community issues be taken seriously by institutional power. Resources that are not accessible to many Athens residents. Students also have a massive influence on the housing market in Athens, so it’s important to recognize the ways in which we can contribute to the problem even as we play a role in trying to address it. Ultimately, our situatedness as a group less likely to face eviction, with access to institutional power, and a major force on the housing market inevitably inform our work. Recognizing my own situatedness and the truths often overlooked by traditional mapping are lessons from Community GIS that I will carry with me for the rest of my career. References Maharawal, M. M., & McElroy, E. (2017). The anti-eviction mapping project: Counter mapping and oral history toward Bay Area Housing Justice. Annals of the American Association of Geographers, 108(2), 380–389. https://doi.org/10.1080/24694452.2017.1365583 Shelton, T. (2021). Situated mapping: Visualizing Urban Inequality between the god trick and strategic positivism. ACME: An International Journal for Critical Geographies, 21(4), 346–356. https://doi.org/10.31235/osf.io/8zswy By Nathan Castro, Community GIS Student in Spring 2023
Beginning my college career I decided to choose geography as my major simply because of the fact that I enjoyed Earth and atmospheric sciences, not knowing what else was waiting to be uncovered. Passing through my freshman and sophomore years at school I was pleased to dig into the material and content I have known and heard about since high school: tectonic plates, geology, weather systems. It wasn't until my spring semester of sophomore year that I decided to take my first course in geographic information science (GIS). I have heard about what GIS was briefly before but did not truly understand the magnitude of its implications. Growing up in my hometown, some of my friend’s parents were GIS analysts so I knew the study was something practicable and enjoyable. Taking that first class, I was hooked on the content, combining my interests of computers and geography! I felt as if I gained a lot of new knowledge out of that intro to GIS course as our professor shared with us his point of view on not only the various programs but also his real life experiences. I remember being told that GIS is an extremely versatile skill that could be paired and applied to practically any discipline. This at first shocked and excited me since up until then, most of the work we had been doing were tutorials in ArcGIS Pro on how to utilize the program’s features. I had far off ideas of what I could personally use GIS for but still felt a disconnect of what meaningful work could really be done. Fast forward to the Spring semester of 2023, I am currently enrolled in the Community GIS Service Learning Course at the University of Georgia. I will be honest, during the registration period, I did not know what a service learning course was or what to expect from one. I had assumed that we would be learning more about using ArcGIS or QGIS but with more emphasis on community problems like traffic or resource management. I would soon come to realize what a service learning course entailed: learning and gaining real world experience and reflecting on those after having performed services to a community. This was not going to be a course of rote learning functions on a computer, this was going to be applying all of the skills I have accumulated over the years to help Athens residents and I was very excited to finally be of use to the community. The community GIS course this semester had been split into two major projects. The first taking the time span of the beginning of the year up until the beginning of March was our work with the Brooklyn Cemetery here in Athens, GA. Many people might not know too much about or even recognize the name of this cemetery as it had been abandoned and unkept for many years, but this place is of great importance to the Athens community as it holds many African-American ancestors of the present generation. Our professor had gotten a hold of the founder of the Friends of Brooklyn Cemetery organization, Mrs Linda Davis, to come talk to our class about the history and importance of the cemetery. This was an eye-opening experience hearing Mrs Davis speak about her connection to the space as a site of remembrance to the community but also herself personally. She herself is so passionate about maintaining and improving the cemetery that if our class could only do enough to assist her in her endeavors, then it would be a very rewarding experience and a success for the class in my eyes. Realizing that GIS could improve Athens changed my view of myself from a student, to a GIS analyst. The class was split into groups to tackle multiple tasks to benefit Brooklyn Cemetery. Some groups were asked to produce new maps of the cemetery grounds, others were in charge of cleaning and organizing data retrieved regarding grave markers, my group was set to produce brand new section markers to post around the cemetery. I was very pleased with this assignment as I could instantly see the value being brought to the community. New section markers would allow for better organization and ease of navigation around the grounds, not only for visitors but also volunteers working to improve the space on community work days. During this process I was able to really get my hands involved in multiple avenues. First we visited the cemetery to inspect the previous markers that had rotten and fallen off their posts to gain an idea of what purpose they served, how many replacements were needed and where they would be placed. Secondly we had the opportunity to create a new design for the markers that could provide visuals and even more information about the cemetery. This was a fun challenge for me since I have not had much experience with graphic design. My team got together and created various mock-ups with different design softwares until we decided on one. Lastly we crafted the signs out of plywood using the UGA Makerspace, a campus resource that provided us access to their laser-cutter and engraver. The final products are something I am proud of as they are a summation of all the various skills I have learned within my time with GIS. This service learning course has been very beneficial to my group working skills as well. Organizing group member’s time and efforts to efficiently get through this assignment has been a challenge but has taught me that the real world is not always so simply laid out. New skills like working with photoshop or a laser engraver have been exciting to learn but I really value the opportunity I had to learn community skills. Managing information between myself, group members and Athens has shown me what GIS can be when implemented with multiple people in mind. Finally seeing in person the impacts GIS can have on the community, I feel like I now have my own instance of providing something valuable through GIS which I wanted since my first intro GIS course. By Matthew Thurston, Community GIS student in Spring 2023
This semester, I have been taking the Community GIS class offered at the University of Georgia. This class is designed to introduce students to how GIS can be used effectively to engage with a community. Before taking this class, my experience with GIS work was limited to producing maps made specifically to be turned in for a grade. I was excited to see this course offered, as it sounded like the perfect experience to give back to the local community after going to school here and also get to use GIS skills for something greater than just producing a map to turn in. Helping the local community is important, especially through work done through the University of Georgia, as I feel so often that the university is not concerned with the local community and instead worries only about what happens within the confines of campus. Throughout the semester, we have learned a variety of topics, but we have been working on two major projects for the majority of the class. Our first main project was concerned with the Brooklyn Cemetery in Athens, Georgia. Brooklyn Cemetery is an African-American Cemetery, and houses many ancestors of people still living in the area. We worked closely with the local community, especially the Board of Trustees for Brooklyn Cemetery and Linda Davis. Hearing her talk and her enthusiasm for this project made me realize the significance of the work we were doing. For this project, we had four main goals that we wanted to accomplish. We first wanted to go back through the cemetery to make sure every gravesite was updated and had a correct location assigned to it. Secondly, we wanted to create both a printed map and an online map that would show the location of the gravesites, as well as other important features. In conjunction with this, we wanted to also create section markers for the cemetery. Finally, the creation of metadata was required in order to make the data of Brooklyn Cemetery organized, and to preserve the data for any future work done on the cemetery. In order to accomplish these tasks, the class split into four groups. My group was tasked with creating the online and printed maps. Additionally, I assisted in the data gathering and cleaning, as this was crucial in producing our accurate maps. In order to do this, we used Field Maps as well as the ArcGIS Map builder online. It was a great experience working in conjunction with everyone. Everyone knew their role, and completed their jobs. Seeing the finished products reminded me that we were doing something much bigger than just producing a map. Compared to GIS classes of old, we were simply given the data already made for us, and then went about producing a map or product. However, here we had to collect the data ourselves. This process was new to me, and something I had not done before in my previous classes. Additionally, this data and map were related to the local community. In projects past, the work we created was usually for maps that had no relation to Athens or any surrounding community. Additionally, this map we were creating would be used by people for years to come. In previous classes, the maps I had created were never really published and had little bearing on anyone. For our second project, we have started work on eviction mapping. This is a joint project being done with the help of the Athens Housing Advocacy Team. The Athens Housing Advocacy Team (AHAT) is concerned with fighting for the right to affordable housing in Athens, Georgia by working and building relationships with renters and other allies in the city. Before this project began, I had no idea that there was such a large problem of eviction in Athens. I knew that rent was increasing in Athens, but I figured that was mainly just in the downtown area of Athens, where a bunch of students live. I had no idea that there were companies buying up large swaths of property in Athens and forcing out residents by declining Section 8 vouchers and driving rent prices up as inordinate amounts. In order to prepare for this project, we read some pieces about situated mapping, critical mapping, and other anti-eviction mapping projects. These pieces were a good introduction into this large topic, as beforehand I was very unfamiliar with segments of it. We have just begun to get into the real work for the project, but I am excited to dive deeper into it. This work seems like it could help the local community greatly, so I am eager to see what we can do in the rest of our class. Overall, this class has taught me the impact that GIS and mapping can have. GIS can be more than just plotting points on a map. Instead, real community work can be done, which involves deep collaboration with the community to produce results that will help them positively. This can be done by talking to local community members, perhaps in meetings or assemblies. By talking to community members, you can sense what issues really plague them, and then develop a plan to help them. I enjoyed that aspect of the Brooklyn Cemetery project, as we listened to what the community wanted and tried to incorporate it into our project. In the next few weeks, I am eager to begin to work more on the eviction mapping project. We have had guest speakers talk to us about the issues faced, and hopefully these issues can be remedied. Looking forward to the far future, I hope I can use the skills learned in this class to keep working for my local community Mase Shepherd, Community GIS student in Spring 2023
Course Summary The first half of Community GIS began with a project associated with the Brooklyn Cemetery in Athens, Georgia. Despite housing many individuals and families with generational occupancy in Athens, this African-American cemetery, as a result of the deep south’s close ties to racism, prejudice, and slavery, has been historically neglected. The trustees of the cemetery, called the Friends of Brooklyn Cemetery, have been working over the years to bestow rightful dignity and honor to their loved ones resting here by improving the cemetery’s overall state. Working in accordance with Dr. Jerry Shannon, the Community GIS instructor, and Linda Davis, a representative from the Friends of Brooklyn Cemetery, our class worked as a team on various projects to fulfill goals we set to improve the cemetery, which included organizing the cemetery into sections, laser-printing section signs, cleaning and speculating existing data of those buried at the cemetery, locating the gravesites of individuals and families in GIS, creating physical and online maps of the cemetery with GIS, and documenting all metadata and processes used to do so. Currently underway, the second half of Community GIS involves working on an eviction mapping project with the Athens Housing Advocacy Team (AHAT), analyzing Athens’ eviction data to ultimately uncover eviction trends that may support local tenants, encourage future eviction prevention programs, and advise relevant policy. Reflection Up until the beginning of Community GIS, although I never considered myself an expert by any means, I thought I possessed a relatively well-rounded idea of what GIS was and what it meant to do GIS. But, as I now understand, there existed a branch of GIS methodology I had not yet been introduced to. I must note, Community GIS has certainly enhanced my technical GIS abilities, in addition to the introduction of new ones. We used ArcGIS Field Maps – a phone application allowing one to access and add data to online web maps made in ArcGIS Online – which I had not done before. We used this tool on-site at Brooklyn Cemetery to gather point data with attribute queries for individuals’ gravesites. We made a searchable web map for the Brooklyn Cemetery using ArcGIS Online’s “create app” tool – a feature that can export interactive maps for public, user- friendly use on media platforms – which I had also not done before. This app, once published on their website, will allow Brooklyn Cemetery visitors to search for, locate, and give regards to friends or family buried at the cemetery. With the recent initiation of our second project with AHAT, we practiced heat mapping and point pattern analysis and aggregation mapping using eviction data in both ArcGIS Pro and QGIS which, again, I had not done before. These few examples represent some of the tangible GIS skills and concepts learned from class and projects, but they do not represent my most valuable takeaway thus far. What I value most comes from Dr. Shannon’s guidance on Community GIS theories and methods in lecture. I never studied GIS in a social environment nor received any form of GIS ideology or philosophy, and I never thought of the importance of such theory in a seemingly rigid discipline that operates on numbers, statistics, and data. However, there is much more to GIS than producing maps and models. This class urged me to think about meaning behind GIS when working with a community, reminding me to reflect on purpose and empathize with those involved. This sense of purpose and feeling of emotional connection through GIS resonated with me, as empathy and emotion resonates to some extent within all of us. With the latter in mind, we also learned that when you do GIS with or for people, you can derive and employ qualitative data along with quantitative data, and I found weight of this new concept. Consider rhetoric, which comprises 3 branches – ethos, pathos, and logos. Rhetoric is a powerful tool that induces change through persuasion. Rhetoric is ingrained in science, used to observe change, study change, relate change, change the way we think, and change what we do or how we act upon something. I think science tends to operate on ethos and logos alone, with ethos usually assumed as a given, and logos the reviewed, repeatable methodology that supports the theory. These two branches of rhetoric drove all of my previous GIS studies. Contrarily, Community GIS taught me to consider pathos when doing GIS, as well. As I mentioned, GIS can be carried out with qualitative data, rather than just quantitative, using audio files of personal accounts attributed to point datasets or pictures and videos from community members linked to a map, for example, which can inspire empathy. This is significant because pathos is an equally important third branch to rhetoric, and including it via qualitative data in GIS can strengthen rhetoric, thus strengthening the power to change. And, when scientific methodology, data, and GIS coalesce, this strengthened power to change can be better used to help improve the human condition. By Casey Serrano, student in Community GIS Spring 2023 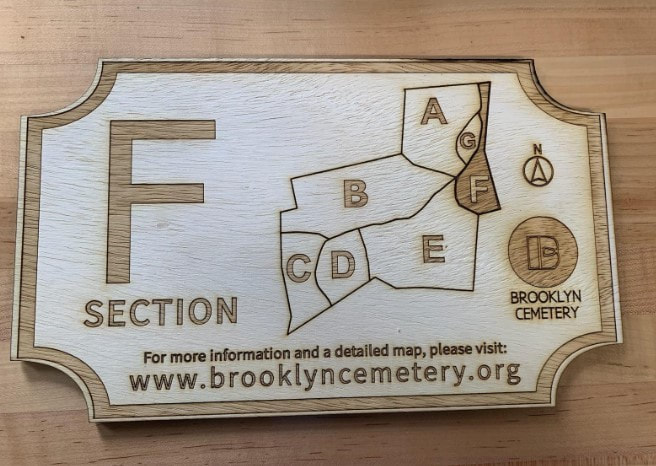 This past week I finished laser-cutting and engraving the section markers part of our class designed to be placed at path intersections in Brooklyn Cemetery, a historically Black cemetery in Athens that was started in the aftermath of the Civil War to provide a respectful final resting place to Black Athenians. Unfortunately, the cemetery was abandoned for decades, and it has takenthe work of several trustees, most notably Linda Davis, to restore the Cemetery from an overgrown state. The Brooklyn Cemetery did have wooden section markers, but they were old and many had fallen off of the trees they were nailed to. With our class’ maps, my connection to the Shirley Mathis McBay Library Makerspace as a student worker, and funds from the Geography department, it was very easy for our group to create new markers for the Cemetery, and in a matter of weeks there will be markers with maps of the Cemetery that are sealed and stake in the ground so that visitors can navigate more easily. The Makerspace is open to any UGA-affiliated patrons of the library for free, and UGA students or staff could revisit this project to replace or update the section markers in the future. I want to use this blog as a place to explain the process of making the signage in detail, and provide some insight into how the process could be improved for the next round of markers.
At the most basic level, making these markers was fairly simple since all we really needed to do was design them, break the design into cut, engrave, and stroke files, use the laser cutter, seal the signs, attach them to signposts, and drive them into the ground. The Makerspace offers classes on laser cutting that are sufficient to prepare a group to use the cutter, and the sealing and implementation of the signs is not a very difficult process. As long as future groups do not want to re-do the signs and their design, the files for creating new ones are available in the Google Drive from this class and can be reused. With some support from the Makerspace, this is a project that any UGA affiliated group, even one not comfortable with mapping, could do. The most difficult part for future groups that are interested in re-doing the signs will probably be the design process. Designing new signs to reflect updated sections, a desire for more information, or to use a different material would be simple, but creating a design that is compatible with the Makerspace’s lasercutter is more difficult. For the signs to be as legible as possible, it is best to engrave the design and then use the score setting to add extra deep and dark lines around the outside of the engraving. Scoring can be used for many things, but for this project it is functionally an outline. Due to technical limitations of our lasercutter’s software, the engraved image must be stored as a raster png file, but the score image must be stored as a vector svg. This is due to the way the machine processes different kinds of images to guide it to either laser larger areas for engraving or very precise lines for cutting and scoring. For a project like this that necessitates creating many similar files with just a few elements changed, it is also important to use one template so that all of the section markers look uniform and the scoring outlines perfectly match the engraving. For our project, we created the original template as a psd (Adobe Photoshop) file, which had some advantages as we were able to use the many design tools available in Photoshop. However, what I realized when I began trying to cut the designs was that the psd files were exporting missing elements when exported to svg files because not all of the elements in the Photoshop canvas were actually vector objects. Photoshop is primarily a raster environment while Inkscape (link here) is primarily a vector environment. This meant that I had to convert all of the elements to vector objects and recreate the design in Inkscape in order to create an editable template that could export well to pngs and to svgs. I would advise future designers to create all of their designs in InkScape or another vector environment from the beginning. Another potential consideration for future groups would be sign material. For budgeting reasons, our group decided to use ¼” Birch plywood that we will treat to be weather resistant. However, there are other, potentially more durable materials that can be put through the laser cutter. Acrylic and anodized aluminum are both materials that can be used in the laser cutter, and with more budget would make good candidates for signage that will not age as poorly as wood. A final consideration for future groups would be to collaborate more with the Brooklyn Cemetery trustees and community. Due to the short time frame of our class, it was not possible for us to work in concert with community members, but I think given more time this would have been a great opportunity to invite local artists to collaborate with us. The cemetery has iron gates, created by a local artist, that depict scenes symbolizing themes of knowledge, religion, and life. I think a project that integrates design elements of the gates into the section markers would be a good option for a future group. By Lan Nguyen, student in Community GIS, Spring 2023
As my time at the university comes to a close, I’m reflecting on my experiences in GIS, even though self-reflection is a generally difficult process for me. I began with an Introduction to GIS course at Georgia State University. After I had transferred to the University of Georgia, the next introductory course I enrolled in was Aerial Photographs and Image Interpretation. These courses taught two software programs: ArcGIS Pro and Google Earth. Through those programs, we applied direct step-by-step instructions with finite answers. Each student resulted with the same conclusion and final map, aside from some personal stylistic preferences. At the end of the semester, we would get into groups for a final project and presentation where we would receive little to no feedback and our classmates do not have enough interest to pay attention. We moved through both classes very similarly. It’s an overall average classroom experience, but I enjoyed the meticulous and intricate process of ArcGIS enough to continue toward a certificate. Aerial Photography in Forestry, taught by Dr. Bettinger, and Community GIS, with Dr. Shannon, are the two last courses in GIS that will complete my certificate. Dr. Bettinger’s course turns the introductory Aerial Photographs and Image Interpretation course into a more specialized concept. I’ve learned practical concepts and interpretation skills that I never knew of before that follow along with US Forestry Service or National Park Service rules. These skills can interpret the difference between deciduous and evergreen forests, and takes another step further by identifying the possible species of the trees based on the regions the images were taken. He manages to capture the class's attention by sharing his own experiences when he was a student or intern for forestry companies. I appreciate these insights since I’m currently applying to internships myself for the next year. They often feel like a glimpse of what my career could look like, even though that’s the path I am unlikely to follow. Dr. Shannon’s course follows a completely different route compared to all three of my other courses. His style and method of teaching are similar to mentorship or internships, except that it is for a class instead of a small group. It’s as if he’s the one that’s the passenger giving map directions and we are in the driver's seat doing the “work”. I want to say “work” in a light manner where we cannot take all the credit. Dr. Shannon is the head of the projects while we facilitate them. We take what we have learned through previous GIS classes, and we apply them here in our projects. During the week Dr. Shannon had to be out of town, I was surprised to find that the class followed the schedule as usual. We had students that took on to be class leaders in a way, we continued with fieldwork in our own times, and we never lost track of progress. If this was any other class, we would have had the class canceled or been assigned remote busy work. The amount of interest the class had for the Brooklyn Cemetery project was different from the other kinds of projects I had worked on in my previous GIS classes. I believe the fact that we had a strong, established, and local relationship with the founder Linda Davis encouraged us to keep working on the project. I loved locally working with the Brooklyn Cemetery. There was a clear goal that we needed to get to even if it took awhile to get there because of the amount of data organization that was required. The metadata organization, at the beginning of the semester, was a concept I had heard of but never truly applied in practice before. In addition, I believe the use of ArcGIS Online, QGIS, and the fieldwork we did at Brooklyn Cemetery was beneficial to establish clear boundaries on a map for the cemetery. I prefer the application process that this class has allowed us to do. I love how this class is a culmination of what I had learned from my other courses into an operation. I can use everything I’ve ever learned for the Brooklyn Cemetery and anti-eviction projects, which is amazing since I’ll be graduating in a few weeks. I hope to apply what I’ve learned from this class to my near-future internship positions. This was a wonderful class to learn from, and I’m excited to see where it will take me on my journey with GIS. By Morgan Mize, Community GIS student in Spring 2023
Before starting college I had never heard of GIS, and if asked I would probably have responded with a similar look of confusion that my peers display when I tell them I’m a GIS major. Yet I have learned so much since then so I would like to reflect on how my knowledge of GIS has changed throughout my time in college. I came to UGA and within my first year changed my major about 3 times before I settled on Wildlife and Fisheries at the College of Warnell. I was happy with my choice until Fall of my junior year when I had to take Spatial Analysis of Natural Resources, a class that everyone told me was horrible. Yet instead of dreading the class like most of my friends, I enjoyed the work and found myself constantly helping my friends on the lab assignments. During this semester I decided to add a major called Natural Resources and Sustainability with an emphasis in geospatial. After that I started to really focus on my geospatial major and that spring I did a co-internship with the Athens-Clarke County Geospatial Office and Keeping Athens Clarke County Beautiful (KACCB). This internship was my first experience in GIS applications outside of natural resources. During my internship I learned about ArcGIS Online and discovered just how broad GIS applications can be. This was my first experience in which I got to learn how GIS applies to the community. My own project was focused on helping the community find and report information relevant to the Adopt-A-Highway program. This semester, Community GIS has given me a chance to once again use GIS to help the community. The biggest difference with this class versus my past experience is that the need for GIS comes directly from the community. Before the work I was doing was based on what my supervisors at KACCB wanted so that KACCB could create a better chain of communication with their volunteers but I personally never interacted directly with the community outside of the KACCB and geospatial office. In contrast the two projects we are doing with this class allows for direct interaction with the community with a specific need. Not only is the method of communication different in Community GIS, but this class has taught things in more of a real world context application then any other class I have taken. For example Community GIS helps people in the Athens community that have a current problem and are searching for a solution in the present. In my other classes the teaching methods tend to always use old or fake data with a set of instructions to get an expected final product that matches the professor’s answer key. The different teaching method helps me to correlate what I am learning to a long term purpose besides an A on this week’s lab assignment. Instead of following the bulleted points meant to walk me through a fake analysis that I will forget the following week, this class allows me to understand how to use and work with raw data. In contrast to other GIS classes, Community GIS is unique because the work is all done for a reason with learning occurring along the way. Overall this class is very unique compared to any other UGA class. I find this to be an interesting experience as I take it alongside another service learning class. While this class works together to achieve goals to benefit the community, my other service learning class is made up of smaller groups working directly with a single property owner. Taking these two classes alongside each other has shown me different perspectives of how one can use UGA knowledge to provide a service to another. In my opinion working with the community requires a more in depth analysis concerning not only the goals, but also looking at why this is an issue to begin with. This then leads into issues involving population demographics and even prejudice towards low income. While my other class is more surface level in which the priority is implementing a plan to help the property owner generate income of some kind. In Community GIS, the relationship with the community is much more delicate in which one has to take into account the emotions of the individuals in the community. While I didn’t start my college journey knowing GIS, I am ending it knowing more about it then I ever thought I would. The past semesters have shown me the wide range GIS has in our world. This class has given me a very different perspective on the impact GIS has in a community. While I still see myself pursuing a career using GIS in natural resources, I believe I can bring with me key takeaways from this class to my future career. For example I believe this class has given me insight into the importance of a client’s emotional connection. For example the history or memories made at a piece of property might mean more to a client than a management plan for timber. I believe that the area of natural resources tends to be more detached from the emotional connection of clients, but I can see how it would be imperative to understand why a client might want to preserve certain areas of land based on emotional rather than textbook reasoning. Whether that reason is because of the client’s memories or history, the emotional connection is something that still needs to be addressed and shows that what the client deems valuable might not always be numbers on a spreadsheet. 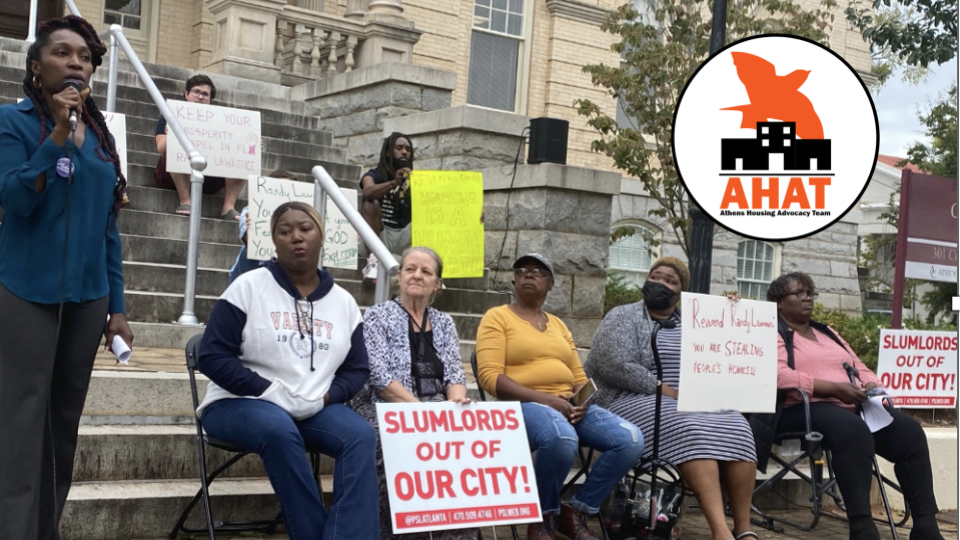 By Vanessa Raditz, Student in Community GIS Spring 2023 Class and Volunteer with AHAT For the second half of the Spring 2023 semester, the Community GIS class will be collaborating on an Eviction Mapping project with the Athens Housing Advocacy Team (AHAT), which is a local grassroots organizing group focused on the “fight for the right to affordable, healthy, dignified, stable housing as both a human right and the right to the city.” AHAT began tracking local eviction cases in 2021 in response to ACC Mayor & Commission conversations on a COVID-19 emergency rental assistance program and the lack of appropriate data about local eviction rates that could inform policy. The research project began with an interest in the impact and pitfalls of two rental assistance programs: the state-level Georgia Rental Assistance (GRA) and the local Eviction Prevention Program (EPP). Neither of these projects continue to operate, though ACC is currently seeking a new community partner to administer the EPP. With funding from the Urban Institute and technical support from the ACC Geospatial Office and the UGA Community Mapping Lab, AHAT has digitized dispossessory files from the ACC Magistrate Court between Sept 1, 2021- Jan 31, 2023, and has created a spreadsheet of data that pulls out relevant information from these files including plaintiffs (landlords), addresses, outcomes of the case, and qualitative notes from the tenant answer form, including if there are any references to GRA or EPP. Through collaborating with the Community GIS class, we want to better understand the data we have collected and what they can tell us about eviction trends. We will also be using other data sets related to Athens property ownership and the EPP program to think about bigger picture processes that create the conditions for evictions in Athens. Through this pairing, we hope this project can help AHAT shift the foundation of this project from “eviction mapping” to “anti-eviction mapping;” maps that can contribute to community organizing and local decision-making that supports tenants. In the initial report attached here, PhD candidate Jessica Martinez lays out some of the initial findings from their qualitative analysis of eviction files from the ACC Magistrate Court, field notes from a year of attending tenant meetings with AHAT, and interviews with AHAT community organizers. This qualitative data shares the ongoing story of housing insecurity in the Southeast from the perspectives of multiply-marginalized tenants and housing advocates. It gathers pieces of the overall story of housing that are frequently excluded or silenced, including the voices of tenant organizers, housing advocates, and community leaders who build complex relationships of solidarity and strategies of resistance that are essential to any initiative to ensure housing for all. 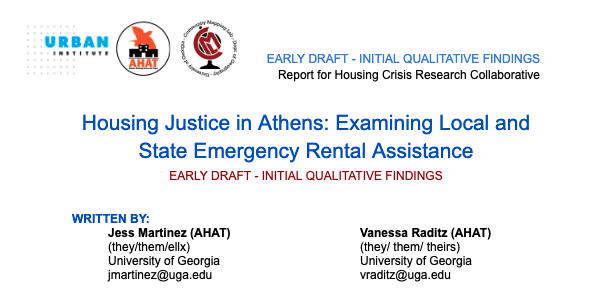
|
Archives
March 2024
Categories
All
|
||

- Home
- About
- Activties
-
Projects
- Athens Wellbeing Project
- ACC Black-owned businesses
- Athens bike routes
- Atlanta Community Food Bank
- Athens 1958 City Directory
- Athens bike routes
- Brooklyn Cemetery
- Evictions in Athens
- GA Hunger study: Proximity map
- Georgia Initiative for Community Housing
- Historic Cobbham Neighborhood
- Hot Corner
- Linnentown
- Sparrow's Nest
- Blog
- Resources
- Calendar
 RSS Feed