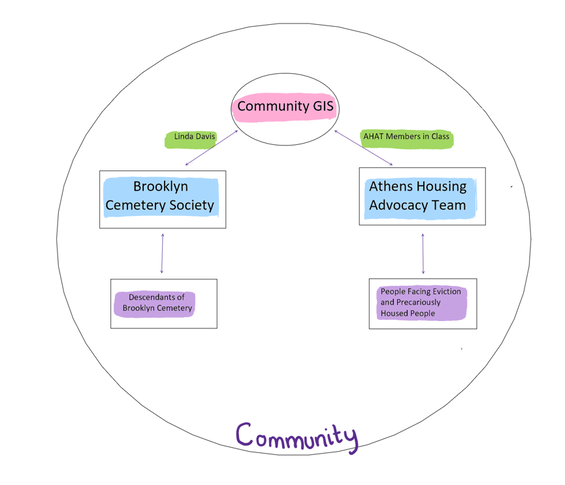
 By Maya Rao, Community GIS student in Spring 2023
Earlier this year, I had a conversion with Dr. Jerry Shannon (my advisor, the professor of Community GIS, and director of the Community Mapping Lab) about project ideas for my Master’s thesis. As I spoke about wanting to do a community-based project, Dr. Shannon asked me “What do you mean by community?” This simple question made me start to think more about the heterogeneity of communities. As the field of community geography evolves, it is important to not equate the word “community” as always the same group of people. When I pictured the word “community” prior to this class, my mental image was of individuals belonging to some kind of shared identity. I did not think of community as including organisations or an amalgamation of different groups and positionalities. Additionally, I failed to recognise how a person can be a part of interacting communities. My approach to the idea of community was extremely narrow, and I have been working to broaden my understanding of this term through the projects in Community GIS. Community GIS Currently I am a student in Community GIS, a class where we learn how to use GIS in community-based projects. In this class, we are working on two projects - first partnering with the Brooklyn Cemetery (a historic black cemetery in Athens, GA) and second looking at eviction in Athens. However, we have also spent time looking at the disciplines of Community GIS, Public/Participatory GIS (P/PGIS), Participatory Action Research (PAR), and community-based projects. Scholars differentiate these fields into their subcategories, but the idea of community still remains a central tenet. Although researchers from the articles we have read discuss the communities they have worked with, few detail a description of who makes up a community. In our class, we are working with two different communities. What is the community we are talking about these projects? Brooklyn Cemetery Project Our first Community GIS project this semester was with Brooklyn Cemetery. This cemetery started housing graves in 1882, making it a final resting place for some former slaves in Athens. This place is full of history, and yet it is not given the public stature that similar historic white cemeteries have in the city. Brooklyn Cemetery has several unmarked and sunken graves. Of the graves that are marked, some markers have fallen over or are no longer visible. For this class, we wanted to make Brooklyn Cemetery and the graves visible. By mapping the graves at Brooklyn Cemetery, we are making a conscious effort to think of these graves as permanent resting places of those marginalized in the past. Our work for the cemetery included making a physical and digital map of visible graves at Brooklyn Cemetery. We also created section markers for the cemetery to better understand how to locate the graves. So who is the community here? We are a community of student-researchers from various backgrounds approaching this project. But who is it that we are helping? Our primary contact for this project was Ms. Linda Davis, the president of the Brooklyn Cemetery Society. Ms. Davis was a great partner to have due to her love for Brooklyn Cemetery and her dedication to preserve and upkeep the space. She provided us with ideas and feedback about our project. She was always appreciative and happy with the work that we completed. As a trustee of the Brooklyn Cemetery, she spoke about things that would help the cemetery and ways for us to assist with their vision. However, we didn’t meet with other members of the board of trustees of the cemetery until the end of the project, which limited our ability to interact with more people comprising the community. The question arises then if this was truly a community based project. One of our class goals was to support not only the trustees of the cemetery, but also the descendants of those buried at Brooklyn Cemetery. Since we only spoke with Ms. Davis for the majority of this project, did we put too much focus on her as the sole representative of the cemetery? Or was this the best thing to do because of the obligations that other people who represent the community have (work, school, etc.). Fitting with discussions we had earlier this semester in class, we discussed how doing community projects is a balance between the researchers and the community. We recognise that as students, we have more time to dedicate to this project compared our community partners. Forcing the other trustees to participate in more of this project may have been inappropriate and contractual. Doing this project made me understand that the rosy idea that UGA students and Brooklyn Cemetery have constant dialogue with each other is not the only way to do a community-based project. We provided deliverables (the maps and data) that the board of trustees of the cemetery were happy with. And, ultimately, this project is the first step in a long term relationship between the UGA Community Mapping Lab and Brooklyn Cemetery. We worked to establish trust and sow the foundations of future collaborations. Eviction In the second half of this class, we are working with the Athens Housing Advocacy Team (AHAT) to clean up data detailing evictions in Athens-Clarke County. We haven’t gotten too far into the project as of now, but our current goal is to clean and validate the data collected by undergraduate researchers and AHAT. Through engaging with this project, I am better understanding the complex “community” we are working with. We have three members of AHAT either in or attending our classes, including one of the founders of the organization. AHAT is the group that we have been in correspondence with, but I question if our community with this organization or with the evicted tenants? If our work is with people facing eviction, what does it mean for us to be working through this middle organization? Prior to this class, I may not have considered working with AHAT a community project, since we aren’t interacting with those directly facing eviction. Earlier in the semester, we read a piece about the Anti-Eviction Mapping Project in San Francisco. This is a project that I can clearly see the community angle, since the researchers are working, organizing, and mapping with people facing eviction in San Franscico. However, for the project that we are doing in this class, working with AHAT may be the best way for us to facilitate a community partnership. Our class has about twenty people (most if not all of whom are not currently facing eviction), so it may have been misguided if we were having conversations with evicted (or precariously housed) people. It may have created a dynamic and hierarchy between us as researchers and our community partners. Working with AHAT allows our class to still provide assistance to this project which will help illuminate the eviction problem in Athens. I’m still struggling with the idea of a community not including evicted people in this project, but I can see how we are indirectly connected through AHAT. However, since we are still new to this project at this point in the semester, I am aware that my ideas may change as we move further in this project. Overall Reflections This class has helped me understand how the communities included in Community GIS are not amorphous and homogeneous. Additionally, the idea of “community” should not be imposed directly by the researcher, because the context of each project will necessitate different relationships between the researcher and the community. This is particularly important to acknowledge in our predominantly white group of students who are not facing eviction. In our class, I’ve had to wrestle with these ideas of who is included in our ideas of community and consider this word in a new setting. So, my original question of who is our community in Community GIS is more challenging than I originally thought. The communities we are working with are multifaceted groups of visible and non-visible members.
0 Comments
By Maya Henderson, Community GIS student in Spring 2023
My driving goal is to be of service to my community, Native nation, and broader Indian Country. Sometimes, however, I struggle to see how obtaining my PhD in Geography so far from home and at a university with limited support for Indigenous students is helping me achieve that foundational goal. I often find myself in this headspace when my coursework and tasks as a PhD student aren’t aligning with my areas of interest and values as a Seneca-Cayuga person and scholar. This semester Community GIS has helped me to recenter me, reminding me why the skills, tools, and knowledge I am obtaining here in Geography at UGA are still in line with my driving goal. I say this for two reasons, the skill sets I am gaining through the course and the involvement and direct aid to the local community. Community engaged scholarship and GIS are skill sets that I can directly employ to be of service to my community. These methodological and technical mapping skills are highly sought after and needed by Native communities and nations. Spatial analysis and more specifically GIS are becoming increasingly used by Native nations for projects including but not limited to land use planning, environmental and sustainability projects, and jurisdiction and political purposes. Since Native nations and communities are employing spatial analysis for community and nation-building projects this has also led to outside partnerships. This often means working with non-Native partners, a reality that although can be fruitful, can also add to the precarity of the Native nation and community. I see Community GIS as allowing me to craft the skills needed to be a Native academic partner for Indian Country. One key reason for precarity concerns when working with non-Native partners is the data required on Native nations and communities for spatial analysis projects. Here the principles of Indigenous data sovereignty and trust become key. Data collection and analysis has always existed within Indigenous communities but data collection and open data under the settler colonial structure in which we live can increase rather than decrease Indigenous precarity. By this I mean that while data can aid Native nation’s sovereignty and goals it also “sits at the nexus of current and historic data challenges as a result of colonisation, bias, and a lack of knowledge of Indigenous rights” (Rainie et al. 2019). It is for this reason that I, as an Indigenous person who is part of Indian Country and accountable to my people, wants to develop these community GIS skills. Our nations and communities can and do benefit from spatial data and its analysis but because of its precarious potential, keeping Indigenous data in Indigenous hands is equally important. Although the Community GIS course has not touched on the idea of data sovereignty explicitly, there has been an iterative process of reflection and intentional decision-making regarding the data we obtain, clean, use, and store. One keyway that I have seen the tenant of data sovereignty in the course is through discussion of data access, storage, and ownership. For one project regarding the historic Black cemetery in Athens, GA we discussed at length where the data should be stored and who could host and gain permanent access. After reviewing accessibility and stability concerns, we decided upon google drive with the community mapping lab rather than a single person hosting the data and permanent access shared with the board members of the cemetery. Carefully considering accessibility, location of data, digital access, and more are essential steps and principles of data sovereignty in the context of community engagement, and I consider them necessary skills, just like those of geocoding and physical map creation. Engaging in these discussions allowed me to draw on what I know of Indigenous data sovereignty and begin to see how data sovereignty tenants can be applied more broadly in community projects. In addition to teaching me necessary skills, Community GIS allowed me to become more grounded in the local community and space where I am living as a guest while I obtain my PhD. Although I aim to always be accountable to my community back home and Indian Country overall, my protocol and teachings as a Seneca-Cayuga woman remind me of my responsibility to be a good guest. By this I mean that I am responsible to and for those around me. Being a PhD student means that I am constantly overscheduled, and it can become hard to find time to engage in community efforts outside the academy. Therefore, Dr. Shannon’s Community GIS course is uniquely situated to aid students, undergraduate and graduate, in becoming more grounded in Athens. The course teaches us about the historical-present of Athens, GA and allows us to meet community members and organizers that we likely wouldn’t otherwise through the various projects we work on in class. For example, working on the eviction mapping project we got to speak with former County Commissioners, City of Athens GIS employees, and engage with representatives of community groups like the Athens Housing Advocacy Team. In doing this we learned more about how the local government operates, the housing landscape of Athens, and what can be done using GIS to aid the community. One project that taught technical and community geography skills alongside place-based histories and present was the Brooklyn Cemetery Project. Working with members of the Black community in Athens on restoring and mapping their cemetery, Brooklyn Cemetery, was particularly impactful for me in regard to engaging my traditional protocol in the Athens context. As an Indigenous person, I am taught deep reverence for our ancestors and the sacredness of their burial grounds. Therefore, it was particularly meaningful for me to be able to aid the Black community here in Athens in mapping their cemetery. The most powerful moment of that project was being able to locate one community member's grandparents in the cemetery using the searchable web map created in the class. Although I am not part of that community and those buried in Brooklyn Cemetery are not my ancestors, I was doing right by my people here in Georgia by aiding the local community in this way. Reflecting on the Community GIS course has helped me recenter my purpose here at UGA. It reminded me that obtaining my PhD is allowing me to create and sharpen many tools that my Native nation and broader Indian Country need and want for our people to have for ourselves. The projects we’ve engaged with this semester, like Brooklyn Cemetery and eviction mapping, have also reinforced the ways that I can be accountable to my people while being far from home. Citations Rainie, S. C., Kukutai, T., Walter, M., Figueroa-Rodriguez, O. L., Walker, J., & Axelsson, P. (1970, January 1). Issues in open data. Indigenous Data Sovereignty. Retrieved April 30, 2023, from https://www.stateofopendata.od4d.net/chapters/issues/indigenous-data.html By Nathan Castro, Community GIS Student in Spring 2023
Beginning my college career I decided to choose geography as my major simply because of the fact that I enjoyed Earth and atmospheric sciences, not knowing what else was waiting to be uncovered. Passing through my freshman and sophomore years at school I was pleased to dig into the material and content I have known and heard about since high school: tectonic plates, geology, weather systems. It wasn't until my spring semester of sophomore year that I decided to take my first course in geographic information science (GIS). I have heard about what GIS was briefly before but did not truly understand the magnitude of its implications. Growing up in my hometown, some of my friend’s parents were GIS analysts so I knew the study was something practicable and enjoyable. Taking that first class, I was hooked on the content, combining my interests of computers and geography! I felt as if I gained a lot of new knowledge out of that intro to GIS course as our professor shared with us his point of view on not only the various programs but also his real life experiences. I remember being told that GIS is an extremely versatile skill that could be paired and applied to practically any discipline. This at first shocked and excited me since up until then, most of the work we had been doing were tutorials in ArcGIS Pro on how to utilize the program’s features. I had far off ideas of what I could personally use GIS for but still felt a disconnect of what meaningful work could really be done. Fast forward to the Spring semester of 2023, I am currently enrolled in the Community GIS Service Learning Course at the University of Georgia. I will be honest, during the registration period, I did not know what a service learning course was or what to expect from one. I had assumed that we would be learning more about using ArcGIS or QGIS but with more emphasis on community problems like traffic or resource management. I would soon come to realize what a service learning course entailed: learning and gaining real world experience and reflecting on those after having performed services to a community. This was not going to be a course of rote learning functions on a computer, this was going to be applying all of the skills I have accumulated over the years to help Athens residents and I was very excited to finally be of use to the community. The community GIS course this semester had been split into two major projects. The first taking the time span of the beginning of the year up until the beginning of March was our work with the Brooklyn Cemetery here in Athens, GA. Many people might not know too much about or even recognize the name of this cemetery as it had been abandoned and unkept for many years, but this place is of great importance to the Athens community as it holds many African-American ancestors of the present generation. Our professor had gotten a hold of the founder of the Friends of Brooklyn Cemetery organization, Mrs Linda Davis, to come talk to our class about the history and importance of the cemetery. This was an eye-opening experience hearing Mrs Davis speak about her connection to the space as a site of remembrance to the community but also herself personally. She herself is so passionate about maintaining and improving the cemetery that if our class could only do enough to assist her in her endeavors, then it would be a very rewarding experience and a success for the class in my eyes. Realizing that GIS could improve Athens changed my view of myself from a student, to a GIS analyst. The class was split into groups to tackle multiple tasks to benefit Brooklyn Cemetery. Some groups were asked to produce new maps of the cemetery grounds, others were in charge of cleaning and organizing data retrieved regarding grave markers, my group was set to produce brand new section markers to post around the cemetery. I was very pleased with this assignment as I could instantly see the value being brought to the community. New section markers would allow for better organization and ease of navigation around the grounds, not only for visitors but also volunteers working to improve the space on community work days. During this process I was able to really get my hands involved in multiple avenues. First we visited the cemetery to inspect the previous markers that had rotten and fallen off their posts to gain an idea of what purpose they served, how many replacements were needed and where they would be placed. Secondly we had the opportunity to create a new design for the markers that could provide visuals and even more information about the cemetery. This was a fun challenge for me since I have not had much experience with graphic design. My team got together and created various mock-ups with different design softwares until we decided on one. Lastly we crafted the signs out of plywood using the UGA Makerspace, a campus resource that provided us access to their laser-cutter and engraver. The final products are something I am proud of as they are a summation of all the various skills I have learned within my time with GIS. This service learning course has been very beneficial to my group working skills as well. Organizing group member’s time and efforts to efficiently get through this assignment has been a challenge but has taught me that the real world is not always so simply laid out. New skills like working with photoshop or a laser engraver have been exciting to learn but I really value the opportunity I had to learn community skills. Managing information between myself, group members and Athens has shown me what GIS can be when implemented with multiple people in mind. Finally seeing in person the impacts GIS can have on the community, I feel like I now have my own instance of providing something valuable through GIS which I wanted since my first intro GIS course. By Matthew Thurston, Community GIS student in Spring 2023
This semester, I have been taking the Community GIS class offered at the University of Georgia. This class is designed to introduce students to how GIS can be used effectively to engage with a community. Before taking this class, my experience with GIS work was limited to producing maps made specifically to be turned in for a grade. I was excited to see this course offered, as it sounded like the perfect experience to give back to the local community after going to school here and also get to use GIS skills for something greater than just producing a map to turn in. Helping the local community is important, especially through work done through the University of Georgia, as I feel so often that the university is not concerned with the local community and instead worries only about what happens within the confines of campus. Throughout the semester, we have learned a variety of topics, but we have been working on two major projects for the majority of the class. Our first main project was concerned with the Brooklyn Cemetery in Athens, Georgia. Brooklyn Cemetery is an African-American Cemetery, and houses many ancestors of people still living in the area. We worked closely with the local community, especially the Board of Trustees for Brooklyn Cemetery and Linda Davis. Hearing her talk and her enthusiasm for this project made me realize the significance of the work we were doing. For this project, we had four main goals that we wanted to accomplish. We first wanted to go back through the cemetery to make sure every gravesite was updated and had a correct location assigned to it. Secondly, we wanted to create both a printed map and an online map that would show the location of the gravesites, as well as other important features. In conjunction with this, we wanted to also create section markers for the cemetery. Finally, the creation of metadata was required in order to make the data of Brooklyn Cemetery organized, and to preserve the data for any future work done on the cemetery. In order to accomplish these tasks, the class split into four groups. My group was tasked with creating the online and printed maps. Additionally, I assisted in the data gathering and cleaning, as this was crucial in producing our accurate maps. In order to do this, we used Field Maps as well as the ArcGIS Map builder online. It was a great experience working in conjunction with everyone. Everyone knew their role, and completed their jobs. Seeing the finished products reminded me that we were doing something much bigger than just producing a map. Compared to GIS classes of old, we were simply given the data already made for us, and then went about producing a map or product. However, here we had to collect the data ourselves. This process was new to me, and something I had not done before in my previous classes. Additionally, this data and map were related to the local community. In projects past, the work we created was usually for maps that had no relation to Athens or any surrounding community. Additionally, this map we were creating would be used by people for years to come. In previous classes, the maps I had created were never really published and had little bearing on anyone. For our second project, we have started work on eviction mapping. This is a joint project being done with the help of the Athens Housing Advocacy Team. The Athens Housing Advocacy Team (AHAT) is concerned with fighting for the right to affordable housing in Athens, Georgia by working and building relationships with renters and other allies in the city. Before this project began, I had no idea that there was such a large problem of eviction in Athens. I knew that rent was increasing in Athens, but I figured that was mainly just in the downtown area of Athens, where a bunch of students live. I had no idea that there were companies buying up large swaths of property in Athens and forcing out residents by declining Section 8 vouchers and driving rent prices up as inordinate amounts. In order to prepare for this project, we read some pieces about situated mapping, critical mapping, and other anti-eviction mapping projects. These pieces were a good introduction into this large topic, as beforehand I was very unfamiliar with segments of it. We have just begun to get into the real work for the project, but I am excited to dive deeper into it. This work seems like it could help the local community greatly, so I am eager to see what we can do in the rest of our class. Overall, this class has taught me the impact that GIS and mapping can have. GIS can be more than just plotting points on a map. Instead, real community work can be done, which involves deep collaboration with the community to produce results that will help them positively. This can be done by talking to local community members, perhaps in meetings or assemblies. By talking to community members, you can sense what issues really plague them, and then develop a plan to help them. I enjoyed that aspect of the Brooklyn Cemetery project, as we listened to what the community wanted and tried to incorporate it into our project. In the next few weeks, I am eager to begin to work more on the eviction mapping project. We have had guest speakers talk to us about the issues faced, and hopefully these issues can be remedied. Looking forward to the far future, I hope I can use the skills learned in this class to keep working for my local community By Sarah O'Neal, Student in Community GIS, Spring 2023 Over the past several weeks, the Community GIS service-learning class at the University of Georgia (GEOG 6385) has been working to update GIS data for the Brooklyn Cemetery. Project kickoff involved watching the documentary Below Baldwin, which concerns the discovery and controversial burial of former slaves’ bodies found under Baldwin Hall during construction. Below Baldwin showcases the university’s reluctance to publicly recognize the history of slavery on campus, as well as its questionable site selection for the bodies’ final resting place. Linda Davis, who is prominently featured in the documentary, as well as other community members, argued for the bodies to be located at Brooklyn Cemetery, an African American cemetery opened 1880. However, the university chose not to consult these community members and instead selected Oconee Cemetery as the bodies’ final burial place. Davis and community members preferred Brooklyn Cemetery for the bodies’ final resting place because the cemetery houses many former slaves’ remains and thus plays a major role in Athens’ African American history. The cemetery features seven sections (A-G), each with varying levels of grave markings—some graves are marked with PVC pipe and others are entirely unmarked, with no way of identifying who lies beneath. The borders of the cemetery and its sections are somewhat ambiguous, and various maps that have been created over the years contradict each other. 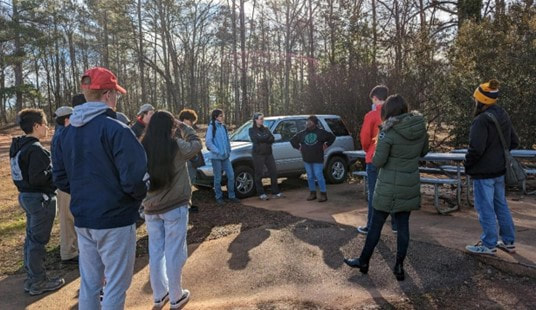 Some graves are marked with PVC pipe and others are entirely unmarked, with no way of identifying who lies beneath. UGA Brooklyn Cemetery Project. For the past several years, Davis and other Brooklyn Cemetery trustees have overseen an extensive revitalization and preservation effort. With the assistance of several volunteer groups and nonprofits, the trustees have backfilled sunken graves, developed roads, cleared substantial overgrowth, and restored gravesites. Most importantly, the trustees have blocked numerous redevelopment efforts—thereby cementing Brooklyn Cemetery’s standing as a significant historical site. 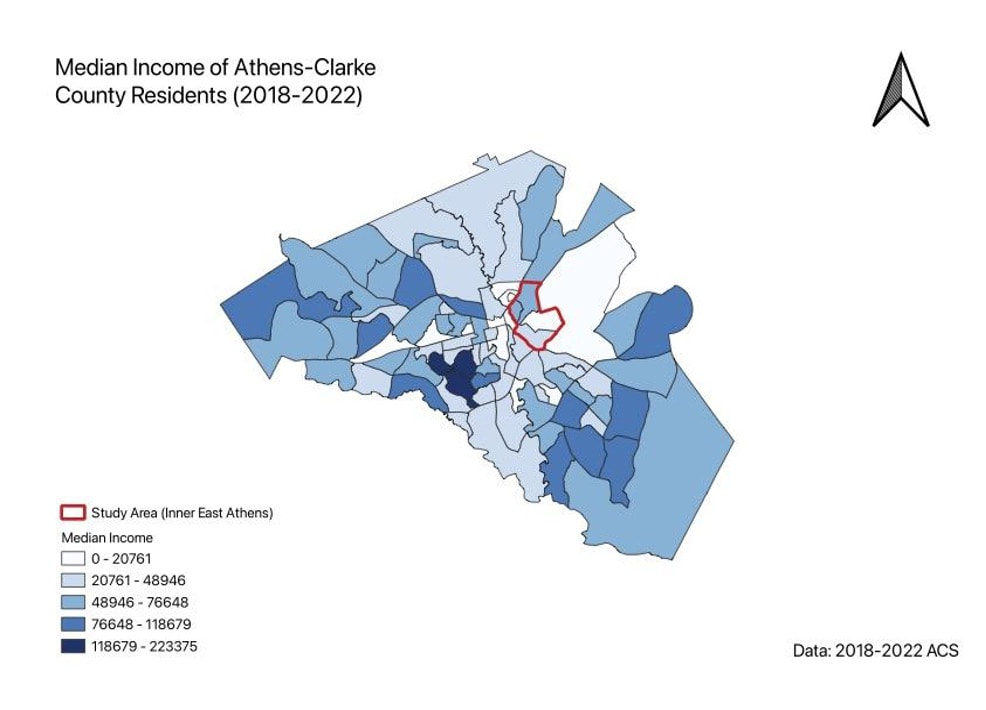 The 2023 Athens MLK Day of Service at Brooklyn Cemetery. The Red & Black; Photo/Libby Hobbs The Community GIS class plans to support these ongoing efforts. As part of Phase 1, the Community GIS class has been working together to clean, merge, and verify existing data points.
The class has four primary goals for the secondary phase of the Brooklyn Cemetery project:
Each of these goals plays an equally important role in the cemetery’s preservation. For each item, the class plans to work with Linda Davis and other community partners involved with the Brooklyn Cemetery. Feedback from these stakeholders will help ensure that our provided solutions continue to be sustainable, practical, and impactful. The class is facing a few challenges with this project. First, the project is constrained by a limited timeline—the Brooklyn Cemetery Project is intended to encompass the first half of the semester, but the weeks are quickly passing. Thus, each group will need to quickly define scope, priorities, and deliverables. Within this hurried timeline, the class must also revisit data from past projects to validate their accuracy. The borders of each section, for example, are somewhat ambiguous and vary considerably in size; the class must define and demarcate precise section boundaries. Also, sections A, B, and E are much larger than the others. The class is considering potentially dividing these sections into subcategories. As part of Group 1, I am tasked with confirming the accuracy of grave marker data— specifically graves containing identifying information. Group 1 has partnered with Group 2 (responsible for developing a cemetery map) to ensure that every marked grave is properly recorded. Next, we hope to create an accurate map that cemetery visitors can access via pamphlet or QR code. During this process, I have faced challenges ensuring accurate locational data because my mapping device (my phone) sometimes has difficulty identifying my exact location. This process demands caution, as any small discrepancy can cause the map to be incorrect. While the mapping project itself is somewhat straightforward, I have struggled with the graves in my section that are marked but the writing has become illegible over time; it is difficult to comprehend that these individual’s identities may have permanently disappeared. I also believe that the unmarked graves deserve to be mapped in some manner, but our time constraints preclude us from doing so. However, by storing and memorializing the graves we can currently see, we protect additional identities from being lost should their physical markers degrade with time. Group 1’s success not only depends on the work completed, but also on the sustainability and adaptability of each deliverable. Our group hopes to produce tangible assets that other community members can continue refining after project completion, and that our community stakeholders can enjoy for years to come. By Tim Naff, Community GIS student in Spring 2023
Mapping and maps in general for me have always been about the visual aspect of it, their pleasing aesthetics and interesting information, nothing more. I've also always been a community-involved person, whether it be helping with food drives or more significant events such as local markets or social/mental awareness-promoting occasions. When I came across Community GIS, taught by professor Jerry Shannon, at the University of Georgia I didn’t hesitate to enroll. Prior to the course, I was unaware there was a way to combine my love for both GIS/maps and supporting my community in both enjoyable and beneficial methods. Throughout the first half of this semester our class has been tasked with creating a digital archive and maps for Brooklyn Cemetery, an all African-American Cemetery in Athens, GA. Formerly known as Bethlehem Cemetery, Brooklyn Cemetery is a historic cemetery that was established in the early 1800s and is located in central Athens. The cemetery contains many grave markers and monuments that date back to the 19th century and it is the final resting place of many prominent individuals from the Athens area, including Civil War veterans, local politicians, and business leaders. However, many are still illegible, unmarked, or unknown. The cemetery is still in use today and is maintained by its board of trustees working to ensure its place and existence in the history of Athens. Through many community events there has been noticeable progress on its restoration, such as cleaning and clearing brush and scanning for unknown buried persons. Our project is on somewhat of a different wavelength but with the same idea in mind, preserving and protecting Brooklyn Cemetery and its history, meaning, and integrity so that future generations, perhaps relatives, can seek their ancestors/family, as well as give locals the chance to learn about important history of their community. Learning about the history and context of what we are working towards was extremely valuable. Not only did I learn about the specific history of the cemetery but other stories and events that happened in the past that correlate with what our issue is, the invisibility and unrepresentedness of African-American related areas. An example is the Texas Freedom Colonies, an reading we did, which illustrates the invisibility of African-American agricultural communities in Texas post-emancipation. This relates to our project because Brooklyn Cemetery is almost invisible locally. It’s invisible in the sense that it is often overgrown in a somewhat hidden forested area and is barely marked. Much like the Texas Freedom colonies which were isolated, unregistered/off the record, and out of the scope of political and economical powers and resources. Another connection is that both have gained recognition in recent decades which is important so that the communities can restore and ensure the legacy they bring. Knowing the history of my community has always been of importance to me because I am a curious person and like to know why things are and where they are. So to get an idea and context for our issue at hand was both interesting and needed for our project. Besides learning about the history, the other important factor was the importance that both sides are tailored to, for class, the process of learning and experience, and for the community members, an end product that is attainable and of quality. Although a community project, this is a college course so learning has been a definitive factor. This is where our GIS “expertise” comes in. I have been introduced to aspects I had not know known, such as sites for data-grabbing, workflows, the importance of metadata, and teamwork. Also to mention are the critical thinking and problem solving aspects as well as the exposure to different perspectives and social injustice issues that are obtained through the process. However, the most valuable aspect for me of this class and project has been the opportunity to get real hands-on/professional experience being the most valuable. Through restoring and engraining the important history of Brooklyn Cemetery online and on-site through references and maps so far I have learned many things and can envision the immensely positive results that GIS and community involved work has to offer. Although unfinished, this project goal should help facilitate the expansion of my knowledge in GIS, my community, history, and perspectives so far. It has already helped me realize the potential of the combination. I’ve already gained knowledge in collaboration, software skills, concepts, and specific history all while enhancing my interest in GIS and community topics. That is all I could’ve asked for. Not even to mention the final product we will have when completely finished for the community members we’ve worked with. I hope it will successfully and effectively inform the community of Athens for years to come. I also hope to be involved in various community initiatives and promote community engagement and collaboration not only after this class but once I graduate to contribute whatever I can wherever I end up living, all whilst continuing to learn about my community and GIS. By Kayla McCartney, Community GIS student in Spring 2023
At the start of the semester, my class begun a collaborative mapping project with the Brooklyn Cemetery. The Brooklyn Cemetery is one of the first African American cemeteries in Athens, GA. From my cursory observation, there seem to be two major kinds of cemeteries. The first kind is the one that remembers and celebrates the people who are buried there. The second kind is the one that people are buried in and forgotten about. Out of sight, out of mind. The Brooklyn Cemetery is an unobtrusive place that would become the second type of cemetery if it weren’t for a few select people fighting for its visibility such as Linda Davis. The purpose of this project was to take all existing data regarding the cemetery and combine and add to them to create a sustainable, informative, and accessible map for those interested in the cemetery. Like many UGA students, I am not from Athens. I am not familiar with the history or layout of much of Athens. Before this project, I had never seen the Brooklyn Cemetery, heard of it, or even driven by it. I had no connection to the Brooklyn Cemetery. So, at the beginning of the project, I approached it like any other assignment: understand what needs to be done, then do it. However, it might be important to understand that while this is a geography class, I am a landscape architecture major, and I approach community engagement projects like a landscape architecture major. A lot of my experience with projects like these has been mostly in the realm of theoretical, and for the few projects actual communities were involved in, they said what they wanted then were majorly hands-off afterwards, somewhat similarly to this project. Something particularly relevant to me that I’ve learned by working more closely with a place like the Brooklyn Cemetery is a better understanding of the attachment to place in people regarding a place I am unattached to. Linda Davis is the most visible advocate for the revival and maintenance of the Brooklyn Cemetery as a historical place. She came and spoke to our class about the cemetery’s historical and emotional significance. As it was established in 1880, only 15 years after slavery was abolished, it was likely many freed people had been buried there. Moreover, there was also a high likelihood her own ancestors were also buried there, which she explained as her strong personal connection. She then expressed to us how strongly she felt about the impact having access to their history and where they came from would have on future generations. These things were significant and perhaps slightly confusing to me because they were things I don’t usually think about. My grandmothers on both sides of my family are Asian immigrants, and in coming to America, they more or less left their roots behind them. Both of my grandfathers have longer histories in the US, however maybe being veterans and not being as close to external living family members has made the history of how we got to this point less important to research or talk about. In my family, there is a much stronger emotional connection to family now than family gone, hence why Linda’s different emotional priorities felt very significant to me. After she spoke to us, my perspective changed. Before, I had no attachment to the Brooklyn Cemetery, and I wouldn’t have necessarily called it important to me. However, after I was able to see how important this place was to Linda and how her connection to her family and roots felt mirrored to my connection to living family, I was able to develop a sense of empathy for this place through Linda’s attachment to the cemetery. More than that, I realized it was important to her. My mind then circled around to the idea that while importance is a relative concept, if looked at objectively, isn’t it universal? I can then start to think, because the Brooklyn Cemetery is important to her, it is important to me. While I don’t know if this revelation truly changes how I approach this particular project, I believe that this kind of awareness of where my values end and another’s begin (how they relate and how to blur the lines) can be greatly impactful for future projects. It is the kind of thing that affects communication, understanding, and empathy which then affect how the project framework develops. When working on community projects, it can be easy to get stuck in the big picture headspace where you have a certain set of priorities and values. It’s easy to think in terms of “What is worth putting time into?”, “What will have the most impact?”, or “How can I best improve [this place] for [specific goals]?”. It’s easy to forget the about the people the change is for. It doesn’t help that many of my projects as a landscape architecture major has us working on community projects with limited if any contact with said communities. In building the world, it shouldn’t be so easy to forget who you are building it for. What I’ve learned from the Brooklyn Cemetery project is that empathy is important. I’ve learned that when approaching projects, I need to come with my ego pre-dismantled. Because at the end of the day, I am not making design or planning decisions for myself. I am making places for people. People cannot be separated from place. So, when making a place, the first question I will ask from now on is who are these people, and what is important to them? By Amber Orozco, Student in Community GIS, Spring 2022 What do you think of when you hear the word “open access” in relation to research or community-based work? Perhaps it brings to mind programs, tools, and academic publications that have no paywall? Or maybe you think of a community that shares resources, such as software code? But in what ways can the approach of open access be a way to support local community organizations? In our Community GIS class, we have spent the last few weeks of the semester thinking through these questions as we work to support the campaign of a local organization, the Athens Anti-Discrimination Movement (AADM). AADM “advocates for racial and social justice and strives to combat discrimination through education and activism”. Part of their efforts includes their “United Against Discrimination” sticker campaign where they ask local businesses to pledge to creating a more diverse and inclusive work environment. If the business decides to participate, they receive a AADM sticker (see photo below) to place on their business’s front window. As a class, our goal is to create a map that will be hosted on AADM’s website, showing the businesses in downtown Athens that are supporters of the campaign. 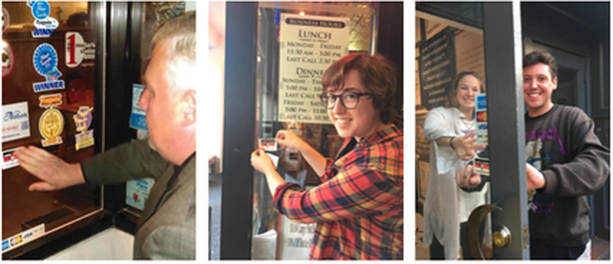 Local businesses in Athens supporting the AADM United Against Discrimination campaign (Photo Credit: AADM) For this project, open access can be understood in two different ways. First, open access for our work takes the form of a process-based approach (Shannon & Walker, 2018), meaning our class is working collaboratively with AADM to gather input on the project, including the timeline, goals, exchange of resources (i.e. AADM provides our class the list of business supporters of the campaign from 2019), and how the map will be both stored and accessed. Our collaboration with AADM is consistent throughout the process, which included us meeting with Denise Sunta (AADM Administrative Assistant and Events/Community Outreach Coordinator and also UGA alumna) at the beginning stages of the project and we will be ending the project with presenting our final map designs to AADM for their approval.
Second, our class is leveraging our technical skills to create this map through an open access mapping program (QGIS) and coding library (Leaflet). Our class was tasked with verifying whether the list of businesses provided by AADM were still participating in the campaign. To do this, our class divided up sections of downtown Athens to assess which businesses had the AADM sticker displayed on their front window. We used ArcGIS’s Field Map data collection application to update this information, including adding new business supporters of the campaign. Our class was able to utilize our university membership to access paid GIS applications, such as Field Map, for this project. Once this list was updated, our class added the geographic coordinates to each business. We were then able to upload this list through excel to QGIS and map out the businesses. Using Leaflet for codes to customize the functionality and appearance of the map, our task is now to develop a map that serves the needs and goals of AADM. Our class is currently divided into different teams, and we are working to develop different options for AADM. For example, my group is working to use codes from Leaflet to develop a pop-up label that will appear when someone clicks on a business that is a supporter of the campaign. We intend to include information on each business, such as the hours of operation, website link, a photo of the business. Additionally, we are developing an option on the map that allows a visitor to filter for the type of business, such as “restaurant, bar, and retail shop”. Once we decide on the format on the map, it will eventually be uploaded and hosted on Github. Personally, this process of transitioning from ArcGIS to QGIS and Leaflet has been challenging because some coding knowledge is required to format the map in my group’s vision. The last time I encountered html was in high school, but I think getting comfortable with these open access programs are a matter of practice and will require more time learning compared to more user-friendly programs, such as ArcGIS. From this experience, I have learned that open access is more than free programs and resources. It can mean leveraging technical expertise as students to support the efforts of community organizations, while engaging the community organization through the process to ensure the organization’s perspectives are centered as the tool becomes developed. Open access extends to the programs we used with no paywall and those programs that we had access to through our university membership. Each of these elements play an important role when partnering and supporting the GIS work of community organizations. By Rachael Glenn, Community GIS student in Spring 2022 I was introduced to the Athens Anti-Discrimination Movement (“AADM”) the summer when the Black Lives Matter movement was in full force. They hosted multiple rallies that successfully culminated in the removal of a confederate monument that once stood in front of the UGA Arch and only feet away from the Holmes-Hunter academic building, named after the first African Americans to attend UGA. There is still a sign behind the Arch naming the Civil War a “war for southern independence,” but I digress. I was happily reintroduced to AADM through our Community GIS course to partner in support of their “United Against Discrimination” sticker campaign. This campaign in particular was sparked by reports of downtown bars racially discriminating against students and local residents of color back in 2016. AADM is a local non-profit here in Athens, GA that focuses on initiatives to advocate for racial and social justice. Some of their work includes hosting community discussions, events, workshops, and resources designed to help people protect their civil and human rights (AADM). Currently, AADM has a sticker campaign called “United Against Discrimination” where businesses in Athens are able to participate with 3 easy steps laid out on their website. 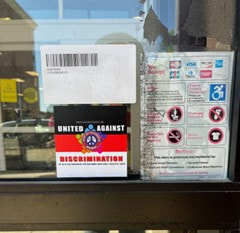 “United Against Discrimination” Sticker on the CVS Downtown Athens “United Against Discrimination” Sticker on the CVS Downtown Athens
The point of the campaign is to commit business owners in the downtown and surrounding area to stand in solidarity against discrimination regardless of race, gender, age, sexual orientation, or immigration status. This campaign highlights a simple yet outstanding way that businesses can create a more inclusive culture. Displaying the sticker, as pictured above, is a physical reminder that everyone is welcome in their establishment. Our Community GIS course has partnered with them to help with the campaign data and to create a web map of the downtown area of businesses that have joined the campaign. Our first step in getting this sorted was verifying which businesses were still participating in the campaign based on the list they provided us. In order to create an updated list for our map, we participated in canvassing downtown, speaking directly with businesses and seeing if they were still participating. Canvassing involves soliciting people, often by going door-to-door for personal contact in an effort to raise awareness, fundraise, politically campaign, and, in our case, collect data and support a local movement. The Athens downtown area is comprised of 170+ businesses, so in the spirit of collaborative work, each student received a block to complete. We used the ArcGIS field maps app so we could directly update business information. The field map app lets users directly update and edit data as they are collecting it during fieldwork. I quickly learned how useful canvassing could be to get accurate data about a community and, in the same vein, how important it is to ensure everyone is on the same page when it comes to community work to produce accurate and usable data. Before starting this process, our class took class time to plan the canvassing. When engaging in collaborative community work, this is such an important step so that 1) everyone understands the goal and definitions involved in the project, 2) knows the process, and 3) how the technology works. In our case, the process was visiting each business in our block, checking who was participating in the campaign, and marking their status. Using the field maps app, I was able to directly update the data into the app for my block, “block 2021.” This is where the planning from before came in hand. I was able to understand which types of businesses we were including, what verified meant, how to add new businesses, what to do with old ones, etc. 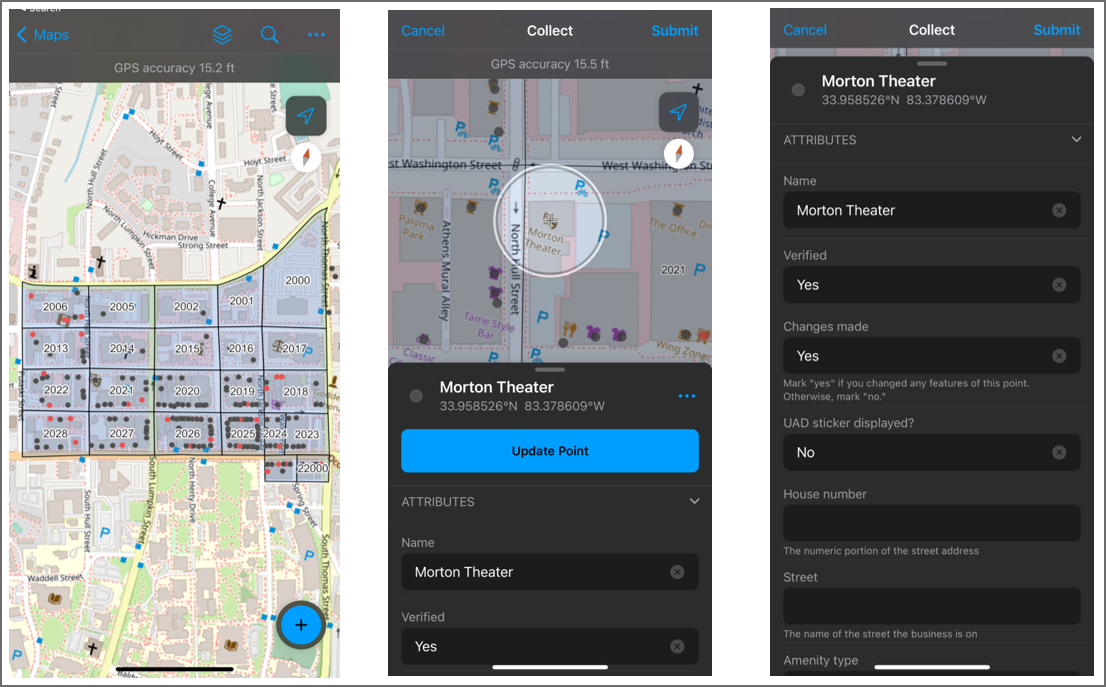 ArcGIS Field Maps App Data Collection Going from business to business was a bit daunting, thinking I could face rejection and even worrying about saying the right words to market the campaign. However, my worries were settled after proposing the campaign to the first business. I found they were open and eager to hear about the campaign and how they could join.
Moreover, from this process, I was able to understand how fieldwork and collaborative work can be managed and facilitated to benefit a community. Our class's work canvassing showed us an easy way to organize and reach many businesses in a short amount of time. However, for this small commitment, multiple people and community members will see the Anti-Discrimination stickers on businesses and perhaps see a more welcoming environment. As UGA students, I think it is incredibly rewarding to do work that is directly benefiting the local Athens community. In most cases, many of us come to Athens to enjoy the city and all it has to offer but fail to give back. This project enabled us to counter this imbalance and participate in a positive social campaign that benefits Athens to learn how to facilitate community work and all the mishaps that can come with it. By Trevor Underwood
Student in Community GIS, Spring 2022 As a student in Community GIS, taught by Dr. Shannon, I’ve been faced with various readings and opportunities surrounding-of course-community GIS. Through exposure to the practices and ideas that have been taught, my approach to mapping (from idea conception to completion) has evolved. By education I’m an ecology major, and most of my experience mapping up until this course had been in mapping ecological phenomena like population dynamics, habitat ranges, and ecosystem boundaries. While those mapping focuses may seem different to the Linnentown storymap and Athens 1958 maps we’ve mapped throughout this course, I think there’s a bounty of approaches to mapping that could stand to be adopted in my niche of GIS. In this blog post, I want to talk about how I would have applied what I know now to past projects I’ve worked on; specifically, as a fisheries technician for the United States Forest Service (USFS) in Oregon. I want to focus on this experience because of the importance of the projects I did there, but also because of the community-project interactions that were present. There’s one specific project I was a part of that I think, if I had known what I know now, could have been handled differently by both myself and those in charge of the project. One of the largest things that struck me during my time in Oregon was the importance of PR. The public’s perception of the USFS in Tiller where I was working was polarized; some people loved you and others hated you. For some, the Forest Service was doing important work that would end up benefitting the public, for others, the forest service was a clandestine organization that was trespassing on “their land”. Our project I was a part of was doing snorkel surveys for the Umpqua Chub, a state-threatened fish species. We would get in wetsuits and hop in rivers/streams at public access points like bridge crossings, boat launches, and roadside pull-offs and record the number of fish we saw along with the coordinates to map later. People would come up to us during/after the surveys and ask what we were doing. After we gave them an answer as to what the surveys were for and why we were doing them, most people would respond with a friendly “cool!” or “that’s neat”, but sometimes people would say we had no business being there and, in a few instances, would harass us. I think if the Forest Service had involved the communities around where we were doing surveys more, we would not only have been on better terms with those communities, but would also see a higher degree of approval for that specific project. In this course we talked about community involvement in GIS, and broke down a figure (Arnstein’s ladder) showing different levels of this type of involvement. In a federally sponsored project, including citizens in a research project to the degree of letting them do GIS analysis would be difficult, but at least getting to the higher rung of “partnership” from “informant” on Arnstein’s ladder would have been satisfactory. In my experience there, the people that engaged in harassment seemed to feel undermined when being informed about what we were doing, maybe feeling as though they were being treated as unintelligent. Building a trust between the groups doing research and the communities in which the research is being done is mutually beneficial, and something I’ll always reflect on when performing work like that again. That shared vulnerability makes for a stronger flow of ideas, and a better product. In our Linnentown storymap project, the experiences and feedback of resident Hattie Whitehead were directly incorporated into the final product. Our project aimed at telling the story of Linnentown, both how it was, and how it’s been erased by The University of Georgia Urban Renewal Project. I was able to benefit from learning from a first-account of the story we were trying to tell. Getting to see and hear about her experiences and having feedback directly from her was extremely helpful, and largely the basis of the depth of quality for our finished product. There wasn’t any preconceived animosity between the parties working on the Linnentown storymap project like there was between the USFS and communities in Oregon, but just the action of communication and transparency like in the project our class worked on are enough to build a foundation of trust. This class has challenged me to think beyond a cartographic result; rather, it’s encouraged me to think of the process of reaching that result. |
Archives
March 2024
Categories
All
|
- Home
- About
- Activties
-
Projects
- Athens Wellbeing Project
- ACC Black-owned businesses
- Athens bike routes
- Atlanta Community Food Bank
- Athens 1958 City Directory
- Athens bike routes
- Brooklyn Cemetery
- Evictions in Athens
- GA Hunger study: Proximity map
- Georgia Initiative for Community Housing
- Historic Cobbham Neighborhood
- Hot Corner
- Linnentown
- Sparrow's Nest
- Blog
- Resources
- Calendar
 RSS Feed