|
By Casey Serrano, student in Community GIS Spring 2023 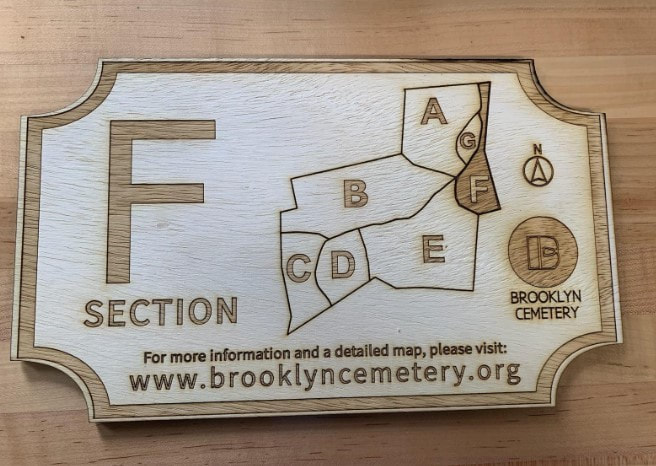 This past week I finished laser-cutting and engraving the section markers part of our class designed to be placed at path intersections in Brooklyn Cemetery, a historically Black cemetery in Athens that was started in the aftermath of the Civil War to provide a respectful final resting place to Black Athenians. Unfortunately, the cemetery was abandoned for decades, and it has takenthe work of several trustees, most notably Linda Davis, to restore the Cemetery from an overgrown state. The Brooklyn Cemetery did have wooden section markers, but they were old and many had fallen off of the trees they were nailed to. With our class’ maps, my connection to the Shirley Mathis McBay Library Makerspace as a student worker, and funds from the Geography department, it was very easy for our group to create new markers for the Cemetery, and in a matter of weeks there will be markers with maps of the Cemetery that are sealed and stake in the ground so that visitors can navigate more easily. The Makerspace is open to any UGA-affiliated patrons of the library for free, and UGA students or staff could revisit this project to replace or update the section markers in the future. I want to use this blog as a place to explain the process of making the signage in detail, and provide some insight into how the process could be improved for the next round of markers.
At the most basic level, making these markers was fairly simple since all we really needed to do was design them, break the design into cut, engrave, and stroke files, use the laser cutter, seal the signs, attach them to signposts, and drive them into the ground. The Makerspace offers classes on laser cutting that are sufficient to prepare a group to use the cutter, and the sealing and implementation of the signs is not a very difficult process. As long as future groups do not want to re-do the signs and their design, the files for creating new ones are available in the Google Drive from this class and can be reused. With some support from the Makerspace, this is a project that any UGA affiliated group, even one not comfortable with mapping, could do. The most difficult part for future groups that are interested in re-doing the signs will probably be the design process. Designing new signs to reflect updated sections, a desire for more information, or to use a different material would be simple, but creating a design that is compatible with the Makerspace’s lasercutter is more difficult. For the signs to be as legible as possible, it is best to engrave the design and then use the score setting to add extra deep and dark lines around the outside of the engraving. Scoring can be used for many things, but for this project it is functionally an outline. Due to technical limitations of our lasercutter’s software, the engraved image must be stored as a raster png file, but the score image must be stored as a vector svg. This is due to the way the machine processes different kinds of images to guide it to either laser larger areas for engraving or very precise lines for cutting and scoring. For a project like this that necessitates creating many similar files with just a few elements changed, it is also important to use one template so that all of the section markers look uniform and the scoring outlines perfectly match the engraving. For our project, we created the original template as a psd (Adobe Photoshop) file, which had some advantages as we were able to use the many design tools available in Photoshop. However, what I realized when I began trying to cut the designs was that the psd files were exporting missing elements when exported to svg files because not all of the elements in the Photoshop canvas were actually vector objects. Photoshop is primarily a raster environment while Inkscape (link here) is primarily a vector environment. This meant that I had to convert all of the elements to vector objects and recreate the design in Inkscape in order to create an editable template that could export well to pngs and to svgs. I would advise future designers to create all of their designs in InkScape or another vector environment from the beginning. Another potential consideration for future groups would be sign material. For budgeting reasons, our group decided to use ¼” Birch plywood that we will treat to be weather resistant. However, there are other, potentially more durable materials that can be put through the laser cutter. Acrylic and anodized aluminum are both materials that can be used in the laser cutter, and with more budget would make good candidates for signage that will not age as poorly as wood. A final consideration for future groups would be to collaborate more with the Brooklyn Cemetery trustees and community. Due to the short time frame of our class, it was not possible for us to work in concert with community members, but I think given more time this would have been a great opportunity to invite local artists to collaborate with us. The cemetery has iron gates, created by a local artist, that depict scenes symbolizing themes of knowledge, religion, and life. I think a project that integrates design elements of the gates into the section markers would be a good option for a future group.
0 Comments
By Will Harrison Student in Community GIS, Spring 2022 The process of georeferencing is very important and useful in many different disciplines of geography. Georeferencing is the process of giving a raster image a geographic reference by overlaying that image to the same geographic reference on the basemap so that the two images align. To do this, you will need to open up a geographic software. I’m going to be using ArcGIS Pro as an example. Once you start a new project, you will see a basemap of the world in front of you. The first thing you want to do is change the projection to a more precise projection. I have changed mine to NAD 1983 UTM Zone 16, because I am dealing with georeferencing within Georgia, which is in zone 16. I would also recommend you change the basemap under the map tab if you are dealing with buildings or parking lots. If you are just dealing with streets, keep it on the topographic basemap. 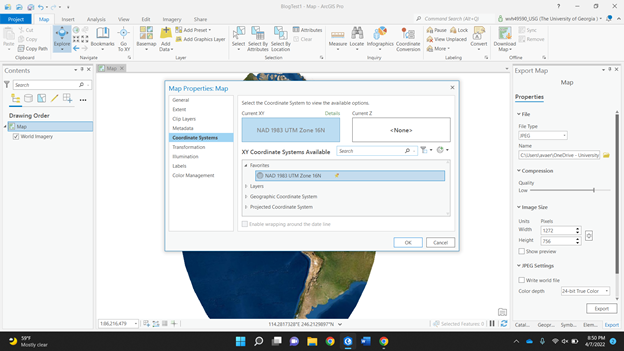 Next, you need to find the raster image. A raster image is a graphic that represents a two dimensional image as a grid of pixels. I am choosing a JPEG campus map of the University of North Georgia. I put the JPEG in the same folder as my ArcGIS project, so when I click add data, I know where to find it. Once it is added, your basemap won’t change. If I go to the UNG campus on the basemap, it will not be there, because the JPEG has no geographic reference. On the left of your screen, you can see the JPEG underneath the contents section. Right click on the JPEG and click “zoom to layer” to find your raster image. If you zoom in or out, you can see it is in a random spot. My image is in the Galapagos Islands. So, now you need to put it in the right spot. 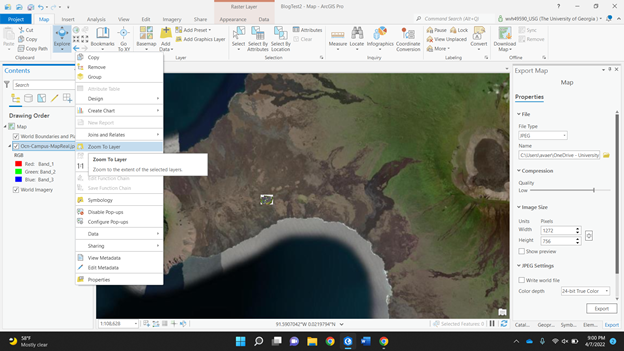 Under the imagery tab, click the “georeference” button to get started. There should be a box indicating so in the top right of your basemap. Then under the georeference tab, click “add control points” to identify a specific point on the raster image. It should show a red square where you clicked. There should also be a dashed line following your cursor. You need to then zoom into where that exact point is on the basemap. It will then show a red circle with an “x” through it to symbolize the completed control point created. Street intersections or building corners are a good reference to use. 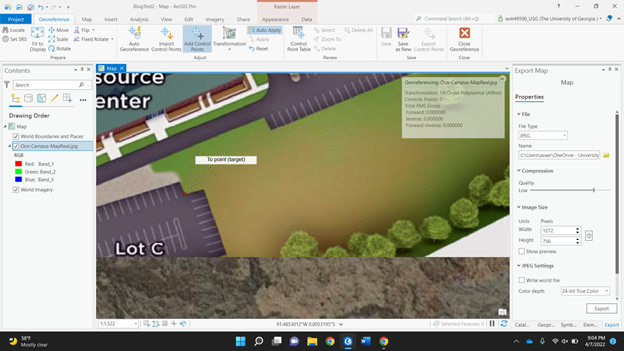 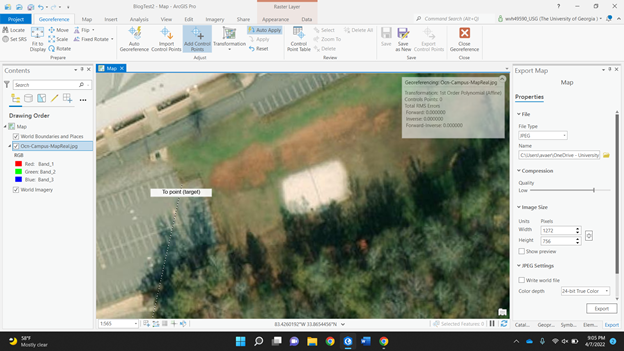 Once you do this, the map should now be in the same general area, except now your raster image is covering your basemap. To get around this, go to the appearance tab at the top. Mess around with the transparency of the image. This way, you can see both images at once. The more control points you create, the more accurate it will be. Trying to add control points on opposite sides of the imagery helps to place it more accurately, quicker. 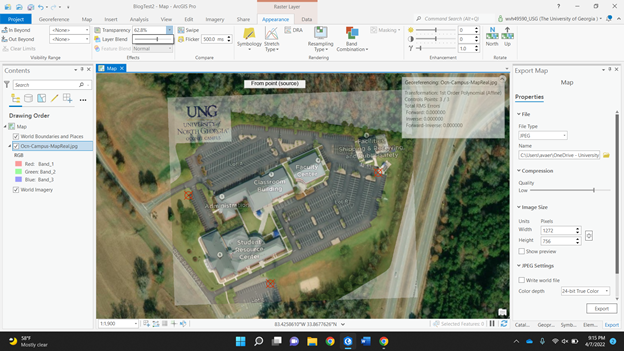 In just three control points, most of my map is placed correctly. If you go back and forth between transparencies, you can see how accurate it is. The buildings, parking lots, and roads will start to align perfectly. If they aren’t lining up, try looking at your control point. If there is not one created near where it is not aligned, try and create one. If there is a control point near and it is still not lined up, you may want to see if a feature has changed over time.
Once again, this can be useful in many different geographic ways. The use of control points, for example, is used by a surveyor on AutoCAD. AutoCAD is another geographic program. The surveyor needs control points to geographically reference himself in the real world to put points on a job site. In our class, we just use it to reference a boundary line JPEG that doesn’t have geographic information attached to it, but it is a relatively simple process if you’d like to do it yourself. By Matt Cassada
Student in Community GIS, Spring 2022 When we initially started the 1958 Athens Census Mapping Project, I had initially a good idea of what I wanted to do since I noticed two distinct features with the Athens Census Mapping Data: population of the entire area along with businesses around the area. Next, I considered the timing of when this mapping took place which was in 1958. During this time, segregation was still a lingering issue across the Deep South, and this was true in both major urban and rural areas. Finally, I noticed that this mapping data also included major businesses around the Athens area and this included pretty much everything that was a business: federal businesses, food, entertainment, religious groups, and many more. With these central ideas already placed for me, I decided upon the following observations:
With this plan, I decided to then form my central question/argument for the project which is: "Based on the location/concentration of either colored or non-colored owned businesses, does the population distribution of colored and non-colored residents seem different across Athens-Clark county area? Do you also see a population distribution difference based on if the particular resident was either a colored or non-colored resident? Is their a particular business that could be made out where we see the strongest correlation and is their one with the lowest correlation in relation to Athens population data and business location’s?" With these questions in place, I then progressed into making my own maps. We all started with a excel/point data of the Athens 1958 Census Data, which we got thanks to cleaning out the initial data. I knew that I had to create two initial data sets just for the residents of the area I made two different point data sets, one for colored residents and one for non-colored residents. This proved to be easy since each resident is listed out if they are colored or non-colored residents. I then inputted the point data into ArcGIS and I then signaling out/deleting the data that was needed for each point set. Thus, when I did this, I ended up with two different point data sets for both colored and non-colored residents. Initially, you do see some distribution differences in the point data. First, we see that the non-colored residents are more spread out across the Athens area and they are not as centralized. This is different for colored residents who were more centralized near downtown Athens and east of Athens. Colored residents were also less dispersed and more organized compared to non-colored residents. They we more organized in that they were more grouped together. When it came to making the business points, I must first start off and say that given that data wasn't 100% complete. We still had some business points that were not complete and plenty of businesses that were not registered in the excel data. But I still pressed on with my maps since I still had just about over 300-400 businesses I could look at. To make the point sets for the businesses, I first needed to make some distinctions between businesses. Since I wanted to look at what kind of businesses had the greatest correlation for residents, I needed to focus businesses out of each point data set and give them their own distinction. After looking through each business, I noticed four different business categories:
With these distinctions in place, I implemented the same overall process I did when it came for the residents in Athens. I cross referenced the points that were businesses and centered on those. I then went through each point individually to look at what category they would fall under based on the distinctions I made. I then repeated this process for all four different business categories. Finally, when it came to patterns that I noticed with the businesses and its correspondence to residents, the one business I noticed that had the most central concentration was near religious businesses, like churches. The one business that had the least appeared to be food businesses, with very little shown correlation between the two for either resident. In conclusion, this mapping project proved to be insightful to me. As someone who has never lived in Athens, its interesting to see how the demographics and businesses across the city has changed since the late 1950’s. This project showed not only how residential demographics has changed, but also how businesses across downtown Athens have shifted: from more of a rural area to a more college-themed town. |
Archives
March 2024
Categories
All
|

- Home
- About
- Activties
-
Projects
- Athens Wellbeing Project
- ACC Black-owned businesses
- Athens bike routes
- Atlanta Community Food Bank
- Athens 1958 City Directory
- Athens bike routes
- Brooklyn Cemetery
- Evictions in Athens
- GA Hunger study: Proximity map
- Georgia Initiative for Community Housing
- Historic Cobbham Neighborhood
- Hot Corner
- Linnentown
- Sparrow's Nest
- Blog
- Resources
- Calendar
 RSS Feed