|
By Reyd Mahan, Community GIS student in Spring 2023
Mapping and Geographic Informational Systems (GIS) have always interested me because they have significant practical use for me as an archaeologist. However, before taking this Community GIS class, I saw GIS as checking a box for my career. I never really thought about the applications of GIS outside of what I needed to do for class or work. As an archaeologist, I typically use GIS to create basic maps of an archaeological site and overlay different forms of data on top of it, such as artifact density or ground penetrating radar (GPR). While these maps are helpful for archaeologists to find where artifacts might be, the public will never see these maps or even know where the archaeological site is located to prevent looting. GIS in archaeology is private and not typically community oriented. Since I started working on the community-based projects for this class, I have gained a new appreciation for the positive impacts GIS can have in local communities that I never thought possible before. I engaged with Community GIS because it allowed me to gain valuable, practical skills and improve soft skills in working with others while also improving the local community through various projects. The first project I worked on was at Brooklyn Cemetery. Brooklyn Cemetery is a historically black cemetery important to the local Athens community. Unfortunately, several graves were damaged over time or lost their marker entirely. Our job as a class was to record the points of each marked grave along with the grave’s information and then create a map that would be useful to cemetery visitors. During the project, we made trips to the cemetery to determine the accuracy of the data we already had from previous projects. Visiting helped me connect with the project by seeing the graves I recorded in person. It gave my work more meaning because I saw its impact in person, not in a spreadsheet. I saw my work as helping to preserve the memory of the people buried there. By recording the location of each grave, descendants can utilize the map to pay their respects for years to come, and we can dignify the deceased by recognizing their burial location. The project also presented some challenges along the way. After we visited the cemetery, we realized that much of the data concerning the location of each grave was inaccurate. On top of that, the GPS on our phones was not the most accurate in recording our active location. To update the data, we went back and personally recorded each point that we could find at the cemetery to make a new accurate point layer that could be used in the final map. The GPS issue was annoying but tolerable since we needed the points around the grave, and pinpoint accuracy was not required to make a helpful map. Much of the project was devoted to sorting our recorded data and correcting discrepancies or duplicates. I’m beginning to understand that much GIS work involves spreadsheets and data management, which is necessary but also tedious. By working with the Brooklyn Cemetery directly, this project showed me that my GIS skills could be used to make positive community impacts and not just for private research-related use. I saw the people I was helping directly, giving my work a purpose. Work in archaeology is far from purposeless, but there are not typically people that are a direct connection to your work unless you are working in consultation or collaboration with indigenous communities. Furthermore, to ensure the protection of an archaeological site, all maps and data concerning the site are private and only accessible to professional archaeologists, which was the antithesis of what we were doing at Brooklyn Cemetery. We wanted the maps and data we made of the cemetery open to the local community so they could be best used. I hadn’t worked with GIS and mapping in a public way before, so it was amazing to see how our work as a class could directly help community members. As of writing this post, we are getting into our second-semester project with the Athens Housing Advocacy Team (AHAT) to better identify and map housing evictions in Athens, GA. While the previous project utilized GIS through community service, the AHAT project focuses on using GIS for social change and advocacy. I am interested in seeing the maps we create at the end of the project that visualize the eviction problems in Athens. This class has shown me how public GIS can benefit the local community, which differs from the typically private GIS utilized in archaeology. More importantly, it has taught me skills that help build stronger community connections that I can use for the rest of my life.
0 Comments
By Constanza Urresty Vargas, Community GIS student Spring 2023 Community GIS is a service-learning course in the Department of Geography at the University of Georgia, where students from different backgrounds and from different years (both undergrad and graduate) converge. This means that as students, we come to the course with diverse skills, knowledge, and interests; although we are all in the same class, we are not learning the same things or in the same ways. During the semester we have engaged in two projects, contributing with GIS tools to local community organizations. The first was with the Friends of Brooklyn Cemetery, a local organization in Athens that works for restoring and rebuilding this cemetery, which is a resting place of former slaves. Their aim is to commemorate the individuals laid to rest there and bring their stories to the present. For the second project we have been working with the Athens Housing Advocacy Team (AHAT), a grassroots activist group that collaborates with renters and allies to fight for the right to affordable, healthy, dignified, stable housing as a human right. Course activities have involved lectures, mapping, discussions, and sessions with several visitors talking about their experiences as researchers, practitioners, or organization members engaged in issues related to the projects. We also had various class discussions attempting to reflect on the purpose and meaning of our work as a class. What do we want to achieve in our projects? Why mapping? How are we contributing to community organizations through maps? Many of these discussions involved collective agreements about the goals of our work and how to address our questions. So, this is a lot about “we” and “our”. Most of the course activities were collective, not individual. In my opinion, this is particularly meaningful, as many of us enrolled in this course because we think community is important. Community mapping processes need skills for working with, thinking with, and learning with others. Co-learning and knowledge co-production is what allows us to be co-producing maps. As an international student in my first year in UGA and in the U.S., collectivity has been vital for my academic experience. Particularly in the Community GIS class, collectivity has been important for my learning process and for contributing to our projects. This is a community-engaged course, which means we are collaboratively working with local non-academic organizations or community members. Consequently, it requires an understanding of the context of these organizations/communities and learning about the problems they are facing. 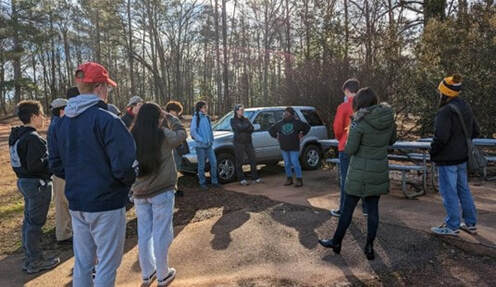 Community GIS class at the Brooklyn Cemetery, in a meeting with Linda Davis (co-founder of Friends of Brooklyn Cemetery) Community GIS class at the Brooklyn Cemetery, in a meeting with Linda Davis (co-founder of Friends of Brooklyn Cemetery) In the case of the Brooklyn Cemetery project, it was necessary to have some understanding about the history of both Athens ant the U.S.; it demanded familiarity with the past in this place, the role of slavery and how this shapes the present in diverse and complex ways. Furthermore, Athens eviction project requires understanding about the social context of housing access in the city, some basics about the housing and eviction legal framework in Georgia, and additionally understanding the nature of available data from local institutions and organizations. All these issues might seem simple, but they are not when you come from a different context, history, and culture. This means new administrative structures, specific concepts, and sometimes different worldviews and social problems. Even more so when you approach these issues not in your first language.
This can be complex and challenging, maybe unfeasible in a short time for international students, as we usually have lived a short time in the U.S. when starting a study program. In those conditions the course might be difficult, as it is highly contextual. However, rather than being an obstacle, all these issues become an interesting and meaningful learning process thanks to the collective. I’m not an individual foreign student navigating an incomprehensible context and struggling to complete the course work. I’m part of a collective, where different knowledges and skills contribute to a common project. Listening to others, being part of group discussions and asking many questions to my classmates is how I could gain some understanding about these issues and shed light on how local communities address their projects. Collaborative and supportive relationships inside the classroom are what makes room for foreign students. It allows us to be part not only of the classroom community, but also the Athens community. This creates space for us, it opens the opportunity to learn from local communities and organizations, while contributing with our work. Sometimes we can also contribute with novel perspectives. coming from the amazement of observing and knowing a new place. While learning from other students about local context, as international student I can contribute with viewpoints as an outsider, which although has some drawbacks, it might be a “fresh” view, in some cases complemented with experiences from different contexts as well. From this perspective the “co” prefix becomes applicable beyond community GIS. This means as a class, we are collaborating not only when creating maps with organizations outside academia (which is the key in this class), but also when doing collective work, co-learning, and co-producing knowledge inside the classroom. Community mapping becomes an intertwining of relationships of collaboration occurring inside and outside the classroom. Community mapping is not only about mapping, but also about collective learning and knowledge co-production, where different skills, knowledge and ideas have a space. By Maya Henderson, Community GIS student in Spring 2023
My driving goal is to be of service to my community, Native nation, and broader Indian Country. Sometimes, however, I struggle to see how obtaining my PhD in Geography so far from home and at a university with limited support for Indigenous students is helping me achieve that foundational goal. I often find myself in this headspace when my coursework and tasks as a PhD student aren’t aligning with my areas of interest and values as a Seneca-Cayuga person and scholar. This semester Community GIS has helped me to recenter me, reminding me why the skills, tools, and knowledge I am obtaining here in Geography at UGA are still in line with my driving goal. I say this for two reasons, the skill sets I am gaining through the course and the involvement and direct aid to the local community. Community engaged scholarship and GIS are skill sets that I can directly employ to be of service to my community. These methodological and technical mapping skills are highly sought after and needed by Native communities and nations. Spatial analysis and more specifically GIS are becoming increasingly used by Native nations for projects including but not limited to land use planning, environmental and sustainability projects, and jurisdiction and political purposes. Since Native nations and communities are employing spatial analysis for community and nation-building projects this has also led to outside partnerships. This often means working with non-Native partners, a reality that although can be fruitful, can also add to the precarity of the Native nation and community. I see Community GIS as allowing me to craft the skills needed to be a Native academic partner for Indian Country. One key reason for precarity concerns when working with non-Native partners is the data required on Native nations and communities for spatial analysis projects. Here the principles of Indigenous data sovereignty and trust become key. Data collection and analysis has always existed within Indigenous communities but data collection and open data under the settler colonial structure in which we live can increase rather than decrease Indigenous precarity. By this I mean that while data can aid Native nation’s sovereignty and goals it also “sits at the nexus of current and historic data challenges as a result of colonisation, bias, and a lack of knowledge of Indigenous rights” (Rainie et al. 2019). It is for this reason that I, as an Indigenous person who is part of Indian Country and accountable to my people, wants to develop these community GIS skills. Our nations and communities can and do benefit from spatial data and its analysis but because of its precarious potential, keeping Indigenous data in Indigenous hands is equally important. Although the Community GIS course has not touched on the idea of data sovereignty explicitly, there has been an iterative process of reflection and intentional decision-making regarding the data we obtain, clean, use, and store. One keyway that I have seen the tenant of data sovereignty in the course is through discussion of data access, storage, and ownership. For one project regarding the historic Black cemetery in Athens, GA we discussed at length where the data should be stored and who could host and gain permanent access. After reviewing accessibility and stability concerns, we decided upon google drive with the community mapping lab rather than a single person hosting the data and permanent access shared with the board members of the cemetery. Carefully considering accessibility, location of data, digital access, and more are essential steps and principles of data sovereignty in the context of community engagement, and I consider them necessary skills, just like those of geocoding and physical map creation. Engaging in these discussions allowed me to draw on what I know of Indigenous data sovereignty and begin to see how data sovereignty tenants can be applied more broadly in community projects. In addition to teaching me necessary skills, Community GIS allowed me to become more grounded in the local community and space where I am living as a guest while I obtain my PhD. Although I aim to always be accountable to my community back home and Indian Country overall, my protocol and teachings as a Seneca-Cayuga woman remind me of my responsibility to be a good guest. By this I mean that I am responsible to and for those around me. Being a PhD student means that I am constantly overscheduled, and it can become hard to find time to engage in community efforts outside the academy. Therefore, Dr. Shannon’s Community GIS course is uniquely situated to aid students, undergraduate and graduate, in becoming more grounded in Athens. The course teaches us about the historical-present of Athens, GA and allows us to meet community members and organizers that we likely wouldn’t otherwise through the various projects we work on in class. For example, working on the eviction mapping project we got to speak with former County Commissioners, City of Athens GIS employees, and engage with representatives of community groups like the Athens Housing Advocacy Team. In doing this we learned more about how the local government operates, the housing landscape of Athens, and what can be done using GIS to aid the community. One project that taught technical and community geography skills alongside place-based histories and present was the Brooklyn Cemetery Project. Working with members of the Black community in Athens on restoring and mapping their cemetery, Brooklyn Cemetery, was particularly impactful for me in regard to engaging my traditional protocol in the Athens context. As an Indigenous person, I am taught deep reverence for our ancestors and the sacredness of their burial grounds. Therefore, it was particularly meaningful for me to be able to aid the Black community here in Athens in mapping their cemetery. The most powerful moment of that project was being able to locate one community member's grandparents in the cemetery using the searchable web map created in the class. Although I am not part of that community and those buried in Brooklyn Cemetery are not my ancestors, I was doing right by my people here in Georgia by aiding the local community in this way. Reflecting on the Community GIS course has helped me recenter my purpose here at UGA. It reminded me that obtaining my PhD is allowing me to create and sharpen many tools that my Native nation and broader Indian Country need and want for our people to have for ourselves. The projects we’ve engaged with this semester, like Brooklyn Cemetery and eviction mapping, have also reinforced the ways that I can be accountable to my people while being far from home. Citations Rainie, S. C., Kukutai, T., Walter, M., Figueroa-Rodriguez, O. L., Walker, J., & Axelsson, P. (1970, January 1). Issues in open data. Indigenous Data Sovereignty. Retrieved April 30, 2023, from https://www.stateofopendata.od4d.net/chapters/issues/indigenous-data.html By Jai'anna Gonzales, Community GIS student in Spring 2023
I decided to take Community GIS for a few reasons. The first is to have the opportunity to work on a project where the data is not neat and prepared for you and has real-world implications. The second is to have more experience in community engaged work, particularly because I have an interest in urban planning. The third is because I knew about the work the Community Mapping Lab did with Linnentown and it opened my eyes to the power of mapping. Situated mapping is a concept introduced to our class through a research article by Taylor Shelton, who came to speak to us about his paper this semester. It was an enlightening conversation about how we can approach mapping from a more complex viewpoint. In this paper, Shelton argues that we can “simultaneously use maps to prove that inequality exists…while also demonstrating that the ways we conventionally think about space through maps are not really sufficient to understand what is actually going on in the world” (Shelton, 2021). The world typically views maps as a quantitative and authoritative method of constructing knowledge. Being able to use GIS beyond these conventional goals and implementing more qualitative and subjective ways of mapping is a useful way to shift the ways we view the world around us, and this has certainly shifted the ways I think about GIS work. For example, another article we read this semester was about anti-eviction mapping in San Francisco, where personal stories, community art, and subjectivity were incorporated into mapping efforts. Instead of simply mapping where evictions occurred, Manissa Maharawal, Erin McElroy, and community members worked to create maps and stories with the intention of making the marginalized visible and challenging the processes that forced people out their homes. These efforts were in direct service to community action and advocacy (Maharawal & McElroy, 2017). Instead of viewing mapping/ GIS as simply a means to an end for tracking an event or occurrence, I can now see how mapping for a specific situation or viewpoint can create maps for action instead of just knowledge. Maps that are about people, not datapoints. This is the framework we established before diving into our work with evictions in Athens. The second half of this spring semester we have been working with eviction data collected by The Athens Housing Advocacy Team, AHAT. We spent the first few weeks getting familiar with the data, other possible data/information sources, the specifics of EPP (an eviction relief program run by the city of Athens) and how it was run, and how our work fits into a larger context of community-engaged mapping. We have broken into groups to address key research questions about the eviction landscape such as: Who is doing the most evicting? Where are landlords located? Who benefitted from EPP? What are the demographics of the communities facing the most evictions? I am on the “categorizing landlords” team, where we are trying to determine how to categorize landlords by number of properties, eviction filings, eviction outcomes, and see how these categories compare. Once it was time to dig in, our team got caught up in the details quickly, so I want to take a moment to reflect on how our work contributes to the concept of situated mapping. By focusing on mapping and understanding landlords instead of tenants, we are attempting to aim the conversation surrounding evictions on those pushing forward the processes of dispossession. Through this project we were able to identify the landlords in Athens filing the most evictions and gather information about their eviction behavior, such as how many filings resulted in evictions. Instead of simply asking ourselves where the evictions are happening, we have tried mapping for action. AHAT and those facing housing stress can reference this data about landlords when deciding the best avenues for advocating for tenants’ rights. Learning critical cartography as a UGA student also provides a better understanding of what exactly our situatedness as students entails. We have access to resources that allow us to help community issues be taken seriously by institutional power. Resources that are not accessible to many Athens residents. Students also have a massive influence on the housing market in Athens, so it’s important to recognize the ways in which we can contribute to the problem even as we play a role in trying to address it. Ultimately, our situatedness as a group less likely to face eviction, with access to institutional power, and a major force on the housing market inevitably inform our work. Recognizing my own situatedness and the truths often overlooked by traditional mapping are lessons from Community GIS that I will carry with me for the rest of my career. References Maharawal, M. M., & McElroy, E. (2017). The anti-eviction mapping project: Counter mapping and oral history toward Bay Area Housing Justice. Annals of the American Association of Geographers, 108(2), 380–389. https://doi.org/10.1080/24694452.2017.1365583 Shelton, T. (2021). Situated mapping: Visualizing Urban Inequality between the god trick and strategic positivism. ACME: An International Journal for Critical Geographies, 21(4), 346–356. https://doi.org/10.31235/osf.io/8zswy By Tim Naff, Community GIS student in Spring 2023
Mapping and maps in general for me have always been about the visual aspect of it, their pleasing aesthetics and interesting information, nothing more. I've also always been a community-involved person, whether it be helping with food drives or more significant events such as local markets or social/mental awareness-promoting occasions. When I came across Community GIS, taught by professor Jerry Shannon, at the University of Georgia I didn’t hesitate to enroll. Prior to the course, I was unaware there was a way to combine my love for both GIS/maps and supporting my community in both enjoyable and beneficial methods. Throughout the first half of this semester our class has been tasked with creating a digital archive and maps for Brooklyn Cemetery, an all African-American Cemetery in Athens, GA. Formerly known as Bethlehem Cemetery, Brooklyn Cemetery is a historic cemetery that was established in the early 1800s and is located in central Athens. The cemetery contains many grave markers and monuments that date back to the 19th century and it is the final resting place of many prominent individuals from the Athens area, including Civil War veterans, local politicians, and business leaders. However, many are still illegible, unmarked, or unknown. The cemetery is still in use today and is maintained by its board of trustees working to ensure its place and existence in the history of Athens. Through many community events there has been noticeable progress on its restoration, such as cleaning and clearing brush and scanning for unknown buried persons. Our project is on somewhat of a different wavelength but with the same idea in mind, preserving and protecting Brooklyn Cemetery and its history, meaning, and integrity so that future generations, perhaps relatives, can seek their ancestors/family, as well as give locals the chance to learn about important history of their community. Learning about the history and context of what we are working towards was extremely valuable. Not only did I learn about the specific history of the cemetery but other stories and events that happened in the past that correlate with what our issue is, the invisibility and unrepresentedness of African-American related areas. An example is the Texas Freedom Colonies, an reading we did, which illustrates the invisibility of African-American agricultural communities in Texas post-emancipation. This relates to our project because Brooklyn Cemetery is almost invisible locally. It’s invisible in the sense that it is often overgrown in a somewhat hidden forested area and is barely marked. Much like the Texas Freedom colonies which were isolated, unregistered/off the record, and out of the scope of political and economical powers and resources. Another connection is that both have gained recognition in recent decades which is important so that the communities can restore and ensure the legacy they bring. Knowing the history of my community has always been of importance to me because I am a curious person and like to know why things are and where they are. So to get an idea and context for our issue at hand was both interesting and needed for our project. Besides learning about the history, the other important factor was the importance that both sides are tailored to, for class, the process of learning and experience, and for the community members, an end product that is attainable and of quality. Although a community project, this is a college course so learning has been a definitive factor. This is where our GIS “expertise” comes in. I have been introduced to aspects I had not know known, such as sites for data-grabbing, workflows, the importance of metadata, and teamwork. Also to mention are the critical thinking and problem solving aspects as well as the exposure to different perspectives and social injustice issues that are obtained through the process. However, the most valuable aspect for me of this class and project has been the opportunity to get real hands-on/professional experience being the most valuable. Through restoring and engraining the important history of Brooklyn Cemetery online and on-site through references and maps so far I have learned many things and can envision the immensely positive results that GIS and community involved work has to offer. Although unfinished, this project goal should help facilitate the expansion of my knowledge in GIS, my community, history, and perspectives so far. It has already helped me realize the potential of the combination. I’ve already gained knowledge in collaboration, software skills, concepts, and specific history all while enhancing my interest in GIS and community topics. That is all I could’ve asked for. Not even to mention the final product we will have when completely finished for the community members we’ve worked with. I hope it will successfully and effectively inform the community of Athens for years to come. I also hope to be involved in various community initiatives and promote community engagement and collaboration not only after this class but once I graduate to contribute whatever I can wherever I end up living, all whilst continuing to learn about my community and GIS. By Kayla McCartney, Community GIS student in Spring 2023
At the start of the semester, my class begun a collaborative mapping project with the Brooklyn Cemetery. The Brooklyn Cemetery is one of the first African American cemeteries in Athens, GA. From my cursory observation, there seem to be two major kinds of cemeteries. The first kind is the one that remembers and celebrates the people who are buried there. The second kind is the one that people are buried in and forgotten about. Out of sight, out of mind. The Brooklyn Cemetery is an unobtrusive place that would become the second type of cemetery if it weren’t for a few select people fighting for its visibility such as Linda Davis. The purpose of this project was to take all existing data regarding the cemetery and combine and add to them to create a sustainable, informative, and accessible map for those interested in the cemetery. Like many UGA students, I am not from Athens. I am not familiar with the history or layout of much of Athens. Before this project, I had never seen the Brooklyn Cemetery, heard of it, or even driven by it. I had no connection to the Brooklyn Cemetery. So, at the beginning of the project, I approached it like any other assignment: understand what needs to be done, then do it. However, it might be important to understand that while this is a geography class, I am a landscape architecture major, and I approach community engagement projects like a landscape architecture major. A lot of my experience with projects like these has been mostly in the realm of theoretical, and for the few projects actual communities were involved in, they said what they wanted then were majorly hands-off afterwards, somewhat similarly to this project. Something particularly relevant to me that I’ve learned by working more closely with a place like the Brooklyn Cemetery is a better understanding of the attachment to place in people regarding a place I am unattached to. Linda Davis is the most visible advocate for the revival and maintenance of the Brooklyn Cemetery as a historical place. She came and spoke to our class about the cemetery’s historical and emotional significance. As it was established in 1880, only 15 years after slavery was abolished, it was likely many freed people had been buried there. Moreover, there was also a high likelihood her own ancestors were also buried there, which she explained as her strong personal connection. She then expressed to us how strongly she felt about the impact having access to their history and where they came from would have on future generations. These things were significant and perhaps slightly confusing to me because they were things I don’t usually think about. My grandmothers on both sides of my family are Asian immigrants, and in coming to America, they more or less left their roots behind them. Both of my grandfathers have longer histories in the US, however maybe being veterans and not being as close to external living family members has made the history of how we got to this point less important to research or talk about. In my family, there is a much stronger emotional connection to family now than family gone, hence why Linda’s different emotional priorities felt very significant to me. After she spoke to us, my perspective changed. Before, I had no attachment to the Brooklyn Cemetery, and I wouldn’t have necessarily called it important to me. However, after I was able to see how important this place was to Linda and how her connection to her family and roots felt mirrored to my connection to living family, I was able to develop a sense of empathy for this place through Linda’s attachment to the cemetery. More than that, I realized it was important to her. My mind then circled around to the idea that while importance is a relative concept, if looked at objectively, isn’t it universal? I can then start to think, because the Brooklyn Cemetery is important to her, it is important to me. While I don’t know if this revelation truly changes how I approach this particular project, I believe that this kind of awareness of where my values end and another’s begin (how they relate and how to blur the lines) can be greatly impactful for future projects. It is the kind of thing that affects communication, understanding, and empathy which then affect how the project framework develops. When working on community projects, it can be easy to get stuck in the big picture headspace where you have a certain set of priorities and values. It’s easy to think in terms of “What is worth putting time into?”, “What will have the most impact?”, or “How can I best improve [this place] for [specific goals]?”. It’s easy to forget the about the people the change is for. It doesn’t help that many of my projects as a landscape architecture major has us working on community projects with limited if any contact with said communities. In building the world, it shouldn’t be so easy to forget who you are building it for. What I’ve learned from the Brooklyn Cemetery project is that empathy is important. I’ve learned that when approaching projects, I need to come with my ego pre-dismantled. Because at the end of the day, I am not making design or planning decisions for myself. I am making places for people. People cannot be separated from place. So, when making a place, the first question I will ask from now on is who are these people, and what is important to them? By Phillip Jones
Student in Community GIS, Spring 2022 Imagine you were tasked with creating a map of your hometown. How would you go about doing this? You may start with popular roads, neighborhoods, and parks. Then, you may throw in some popular landmarks like the city hall, schools, and libraries. This may seem like a straightforward and fact-oriented task. However, you can’t possibly map everything in the town, as this would be overwhelming for the reader and impossible for you do to by memory. You may find yourself choosing landmarks that are most important to you. You may also find that the overall impression of your map reflects your perception of your hometown. The map may be dreary or dull if that is your perception of the town, or it may be brightly lit and exciting if you have fond memories of your childhood. Maps often give the impression of being concrete and factually correct. However, like any other form of media, they are narratives being proposed by their authors. In our Community GIS course, we have been introduced to theoretical frameworks that help us question the intention behind a map: Who created this map? Who is the intended audience? What biases may the author be influenced by? What narrative does this media promote? What voices are missing from this map? Ultimately, we have learned to be wary of the predominant narrative of maps, as they may be reflective of the loudest and most powerful. Most recently in our Community GIS course, we have finished a project about the Linnentown neighborhood in Athens, Georgia. Linnentown was a Black neighborhood along Baxter Street that was destroyed by UGA and the City of Athens in the 1960s through a federal Urban Renewal grant. All houses in the urban renewal area were torn down and all residents were displaced. In their place, UGA built three large dormitories and a parking lot to house freshman UGA students. Through their power, the city and the university characterized the neighborhood as run down and a “slum” to justify displacing a proud and close-knit Black community. Because of the efforts of first descendants of Linnentown and organizations such as the Linnentown Project, the neighborhood’s story has been told, and steps have been made to acknowledge the harms done and provide reparations. To support their efforts, the Spring 2022 UGA Community GIS class has created an ArcGIS Storymap to support the Linnentown Project and first descendants of the neighborhood to bring memories of the neighborhood to life. The Storymap synthesizes first-hand accounts from first descendants Ms. Hattie Whitehead and Mr. Bobby Crook, archived records from the UGA Special Collections Library, and research by UGA professors to tell the story of the Linnentown community, its erasure, and the resistance of its residents to their removal. For example, through a guided video tour, Ms. Whitehead and Mr. Crook share their memories of the neighborhood, which is a sharp juxtaposition from what the area looks like today. It also the process of UGA acquiring properties in the area, aerial imagery displaying the destruction and replacement of the Linnentown community, and evidence of the resident’s resistance to being displaced. The Storymap culminates with a timeline of advocates’ efforts to demand redress and resources on how to become involved. In Community GIS, we have learned that there is no one correct way to describe an area. Instead, many perspectives can all coexist at the same time. However, the perspective of the area around Baxter and Finley Street as just freshman dorms is incomplete and is an injustice to the community of people in Linnentown that were displaced from this area. Using digital storytelling technology, we can share memories, identify important landmarks, and explain how Athens and UGA used their institutional power to transform these areas at the expense of the Linnentown community. Doing so will not bring back what was lost, but this tragic history must be exposed. It is never too late to hold institutions and people to account for their actions, as doing so will communicate that the unjust destruction of people’s homes is unacceptable and prevent it from happening again in the future. By Bryant Beall
Student in Community GIS, Spring 2022 I am currently taking a class called Community GIS. Community GIS teaches how GIS is used to research by local agencies, and community groups. In Community GIS we have mainly focused on a small former community in Athens called Linnentown. I always really enjoy learning more about local history because it can help explain why things the way they are today. History is even more interesting to me when it involves people or organizations that I know of or are physically close to. This is partly why I have found our study of Linnentown to be so encapsulating. Linnentown was a historically black neighborhood off of Baxter Street near the campus. In the 1960’s Linnentown was demolished by the University of Georgia so that they could build the dorms. The residents of Linnentown were forced to leave their homes and community as the University slowly acquired all plots of land through eminent domain or private sales. Residents were forced to leave their communities that they had lived with and trusted some for generations. In class one of our required readings was from a book titled Giving Voice to Linnentown. This was a story of what it was like to live in Linnentown from the point of view of a former resident Hattie Thomas Whitehead. This personal account struck me hard because it shows the fears and experiences that someone had when they were told they have to leave their community. She tells a story that the university had bought the land that their rented house was on so they bought a different Linnentown plot and built a house on it. The city approved the construction and said they would add plumbing to the house, but they never did. Soon after, the rest of Linnentown was acquired by the University, even the new house. The city knew that this land would soon be owned by the university, so that raises the question. Why did the city approve of this construction and waste this families time and money when they knew the whole time that it would soon be university property? After learning about this story I could not help but feel shameful about the school that I love. I love this city and I love this school but it makes me feel very sad to think about some of the extreme wrong doings done that they are responsible for. I wish that the University of Georgia would acknowledge what happened and issue an apology or do anything about this situation. I know a statement could never fix what they did and the families they uprooted, but it is at least a start and better than ignoring the blame like they are currently doing. In my Community GIS class we are currently working on a story map project covering the history of Linnentown. My hope is that when people come across this story map they will not only be informed of Linnentown and the hardships its residents experienced, but that it will inspire people to speak up and raise awareness for Linnentown and other communities that underwent urban renewal projects. Taylor Hafley, Jerry Shannon, Aileen Nicolas, and Jon Hallemeier In a controversially entitled NYT op-ed, Maps Don’t Lie, Charles Blow argues President Donald Trump has no regard for the truth. Blow frames his argument around ‘sharpie-gate’--a reference to the President’s marker-modified map of Hurricane Dorian’s path--and places his trust in maps, writing “because of [the] unyielding commitment to accuracy, I believe cartography enjoys an enviable position of credibility and confidence among the people who see it. If you see it mapped, you believe.” We certainly appreciate NYT’s op-ed page highlighting the value of geography and mapmaking, but as a group committed to investigating the hidden assumptions behind maps, Blow’s argument gives us pause. By anchoring his sharpie-gate critique on cartographers’ commitment to ‘accuracy’ and ‘precision,’ Blow situates his argument on shaky ground. Maps may be factual, but they can also certainly deceive us--no sharpie required. We commend Blow for defending cartographers so strongly, but as Mark Monmonier recently restated, maps lie, and they do so regularly. Below, we identify three reasons to hold back from the “maps don’t lie” defense. Mutilated maps can be good Blow says he found the “mutilated map...just too much’, arguing that mapmaking has a long commitment to factual accuracy and that the work of cartographers should not be defiled. This puts professionally-created maps on too high a pedestal - maps can and sometimes should be "mutilated." For example, the same sharpie pen might be wielded by a meteorologist from the National Weather Service to communicate real-time changes to weather models. Or, in another context, a community member might "mutilate" a map created by cartographers because it is missing critical pieces known only by locals. Indeed, maps are not merely visualized facts. Rather, they present robust narratives about the world and the processes that shape it. These stories work in part due to mutual trust in the maps and mapmakers. As the Floating Sheep collective argued, sometimes “Pretty maps are better than ugly maps, but ugly maps do in a pinch.” Beautiful maps can mislead Second, maps can be accurate, marker-free, and enable a person to tell the story of their choosing. For example, Trump’s fascination with electoral college maps has been well documented. One hangs in the West Wing and according to the Washington Post, Trump was handing out copies of the 2016 electoral college map several months into his presidency, saying his election was ‘redder than an electoral victory had ever been.’ Yet the same data can look quite different when controlling for population, as Kenneth Field’s gallery of election maps demonstrates. The president’s favorite map doesn’t lie outrightly, but it certainly provides a misleading view of the political landscape. Maps tell stories that are selective Third, maps provide partial facts and shape public understanding through a cartography of omission. Maps contribute to larger, simplified narratives which have real-world consequences. For example, maps of crime or school rankings on real estate website may shape homebuyers’ decisions. Yet these maps leave out a long history of policies from redlining to zoning that have created and maintained a deeply segregated landscape, and in doing so contribute to the reproduction of those same socioeconomic divisions. Conversely, maps are at the same time instrumental in challenging these histories and omissions. For example, San Francisco’s Anti-Eviction Mapping Project or this map of white collar crime zones show how maps can provide counternarratives that shape public conversations about neighborhood identity. The point isn’t to make a map that tells the whole story, but a map that tells the right one. What is the right story, we might ask? Therein lies the issue, as this is a political and ethical question, not an empirical one. We applaud the painstaking work of meteorologists who create maps that save lives, and we agree that maps should strive for factual accuracy. Even so, every map’s story is always partial, involving questions such as how to demarcate uncertainty and risk. A sharpie may even sometimes be needed. In this light, the president’s Alabama hurricane may provide a lesson on how to read maps. Rather than decrying the mutilation of ‘truthful’ maps, we should look at all maps with a critical eye, seeking to understand the stories they tell and obscure. David Hecht Imagine you are a project officer with an international development agency. You are charged with assessing the water resources, quality of access, and management-related challenges of a rural community in Eastern Tibet. You are provided substantial funds by your organization to facilitate a Participatory Rural Appraisal (PRA), an increasingly common method to involve community members in planning, knowledge exchange, and decision-making to address perceived local problems. You, your development project team, and volunteers from the community work together on a map to document land and water management issues in the region. This map will be a key product for future planning with your agency and will be included in the annual report. One community mapping participant remembers seeing twice as much winter snow accumulating along the mountain ridgeline, just 10 years ago. You put it on the map. Another participant notes the declining abundance of suitable alpine grasslands for their herds of sheep and yak. You put it on the map. Every participant remembers the day they saw a dragon ascending into the sky near a glacier-fed stream. You pause. You don’t put it on the map. For many Tibetan Drokpa, dragons are real. They’ve seen them. In the positivistic world of western science, a legacy that deeply informs our governmental, non-governmental, and academic institutions, dragons belong to folklore, to myth, and to metaphor. As makers of participatory maps, I think we need to map the dragon. Beyond metaphor. Beyond folklore. Dragons have a place in this map because they exist in the shared cultural worlds of the map makers. Drokpa knowledge of dragons does not need a western positivist knowledge filter. It does not need to be validated by scientific objectivity, or confirmed under foreign protocols of “data” or “evidence”. As makers of participatory maps, I think we need to challenge the space of assumptions associated with other cultural realities. Beyond fiction. Beyond myth. I think we need to interrogate the epistemological foundations of our institutions, and recognize that the edge of our maps of knowing may be the beginning (or center) of somebody else’s. After all, there are no neutral ways to represent “reality” on a map; any “reality” depicted is largely informed by ones’ intellectual and cultural predecessors. In “Dragons, Drokpa, and a Drukpa Kargyu Master”, Diane Barker, recounts testimonies of those who have seen dragons in Tibet, positioning them alongside stunning depictions by Choegyal Rinpoche. Her article makes me pause. It forces me to re-consider the perspectives and worlds deemed legible in academia, and the constraints of the technologies we employ to help compartmentalize and categorize our complex world. Maps and map making can help us to visualize spatially complex interrelationships between social and natural forces. Relationships between water scarcity and elevation, for example, or grassland abundance and shifts in human land-use over time. Maps produced with Geographical Information Software (GIS) can take us even further and help us to measure these complex interactions by experimenting with scale-dependent variables and spatial layers. GIS, as such, is a powerfully important spatial toolset for map making. It is, however, worth recognizing both its technical and epistemological constraints. Rundstrom (1995) suggests that “GIS technology, when applied cross-culturally, is essentially a tool for epistemological assimilation, and as such, is the newest link in a long chain of attempts by Western societies to subsume or destroy indigenous cultures”. Perhaps it is, in certain contexts. This point is considered in depth by Dr. Kenneth Bauer (2009) who notes that embracing GIS, and the worlds we create through mapping, means embracing a “mode of thinking”. Bauer argues that “one’s knowledge of the environment lies not in the ideas in our heads but in the world that our predecessors reveal to us”. If our intellectual predecessors are international development officers, who focus on the material and societal needs of the “developing” world, not only will our maps reflect these priorities, but the edge of our maps will hold epistemologically particular metaphorical dragons. If our predecessors are geospatial scientists, many of whom focus on the scalar dynamics between social and natural systems, the edge of our maps will hold equally specific metaphorical dragons. And if our intellectual predecessors are nomadic Drokpa herders, the center of our maps might include real, non-metaphorical dragons. Then, the edge of our map, the boundaries of our known world, may hold something entirely different. Something as foreign as Participatory Rural Appraisal (PRA). Something as foreign as “development”, “geospatial science” or “conservation”. 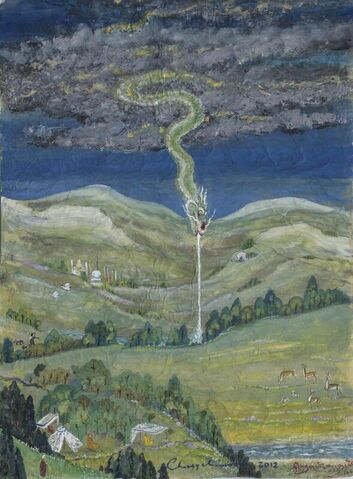 “Dru gu Choegyal Rinpoche's painting of a dragon sucking up water from a stream in Tibet, 2012” Dragons, Drokpa, and a Drukpa Kargyu Master In the end, local Drokpa knowledge of dragons may not be commensurate with western knowledge mapping traditions; spatial frameworks that we, as academically-inclined map makers, can know and interpret: 2D, cardinal direction, cartographic maps. Unless we expand our definition of “map”, perhaps Choegyal Rinpoche’s paintings can simply remind us that the edge of our mappable world does not mean the world’s end. Certain cultural realities and worlds of knowing may simply be invisible to us, unless we choose to radically challenge our own preconceptions, trusting and supporting the deeply held realities of our community mapping partners. Indeed, there are different worlds in each of us. There are also shared cultural worlds that invisibly govern our institutions, design our technologies of visualization (i.e. GIS), and condition what we deem “mappable”. What if, when reaching the boundaries of our own mappable knowledge, we consider how to support other worlds of knowing in our work. We must ask ourselves how we diminish other worlds of knowing by assimilation into our own. Perhaps we can recognize our privileged positionality as map-makers and practice radical epistemological reflexivity, challenging our categories of “data” and “evidence” to produce new maps. Maybe we map the dragon. As mappable as increasing annual glacial snow melt. As mappable as declining range and extent of alpine grasslands. But can we truly re-consider and re-evaluate our core perspectives, biases, and beliefs during this process? The worlds we know and occupy? Perhaps not completely. What’s more, would such radical reflexivity necessarily dis-empower our scientific perspective in a post-truth world? I don’t think so. I think it broadens our capacity as social scientists to engage in and practice epistemological humility rather than epistemological assimilation. In my research in Bhutan, known as the Land of the Thunder Dragon, we use participatory mapping as a medium to talk about spatially-explicit, place-based deities, spirits, and divinities that reside and preside over forests, lakes, trees, rivers, and mountains. These more-than-human beings have significant bearing on the ways people make land-use decisions, and conceptualize foreign concepts of development, conservation, and natural resource management. By including dragon sightings in the Drokpa community map, without pause, without filter, our Participatory Rural Appraisal (PRA) will not simply pay lip service to aspirations of “participation”. Instead, the map will be a better reflection of the different worlds that reside in each participant, and more representative of the worlds inherited by our intellectual predecessors. When the map is complete, it will inevitably be incomplete. Maps will always hold unknowns & uncertainties, assumptions and biases, at their edges. If our aim is to challenge these assumptions, we must put the dragon on the map. Beyond myth. Beyond metaphor. We must challenge who has the power to define the “we”: the voices and viewpoints at the table. A map of this type, however partial, may be a stepping stone to increasingly egalitarian representations of our respective cultural worlds: as academics, international development officers, geospatial scientists, and Drokpa herders. Author David Hecht is a PhD candidate in the Integrative Conservation & Anthropology program at the University of Georgia. His research explores the intricacies of sacred landscapes and lived religion in relation to community-based conservation programs for priority bird species in Bhutan. Follow him on Twitter at @davidmhecht. |
Archives
March 2024
Categories
All
|
- Home
- About
- Activties
-
Projects
- Athens Wellbeing Project
- ACC Black-owned businesses
- Athens bike routes
- Atlanta Community Food Bank
- Athens 1958 City Directory
- Athens bike routes
- Brooklyn Cemetery
- Evictions in Athens
- GA Hunger study: Proximity map
- Georgia Initiative for Community Housing
- Historic Cobbham Neighborhood
- Hot Corner
- Linnentown
- Sparrow's Nest
- Blog
- Resources
- Calendar
 RSS Feed