|
Yangjiaxin Wei Over the decades, researchers have increasingly looked into the effect of neighborhood stores and other food options on residents' health (Caspi, Sorensen, Subramanian, & Kawachi, 2012). Many researchers have found that food environments play an important role in individuals’ health outcomes (Bleich, Jones-smith, Wolfson, & Zhu, 2015; Cummins, Macintyre, & Glasgow, 2002; Willett, 1994). The Supplemental Nutrition Assistance Program Education (SNAP-Ed), funded by the USDA’s Food and Nutrition Service, also aims to improve the nutrition and healthy lifestyle knowledge of individuals who are SNAP participants and low-income individuals eligible to receive SNAP benefits or other federal assistance. Agencies in each state contract with the USDA to provide classes in nutritional education and sponsor initiatives to encourage healthy food choices. The University of Georgia (UGA) SNAP-Ed program is a collaboration between the Department of Foods and Nutrition and Cooperative Extension that aims to help low-income populations in Georgia establish healthy eating habits and a physically active lifestyle through evidence-based nutrition education and local campaigns to promote consumption of healthy foods. This includes online content showing cooking and shopping tips, advertising campaigns, and outreach to K-12 schools.  Source: UGA’s Food Talk website During my Master’s degree work, I was a research assistant for the UGA SNAP-Ed program. I worked with Dr. Jerry Shannon to provide spatial analysis and mapping that supported UGA SNAP-Ed program. Using GIS technology, we mapped out areas with high percentages of eligible populations where more than half the population’s income was below 185% of the poverty rate, areas within one mile from Free and Reduced Meal School, Georgia Promise Zones and Georgia Strike Force zones. Sites intersect with any of these areas above are considered as qualified nutrition education sites and are eligible for SNAP-Ed programming. In this article, we present an open source interactive web tool using leaflet JavaScript library for UGA SNAP-Ed to locate eligible outreach sites and obtain qualification results. These years, there has been a shift from “closed” environment to “open source” environment both in academia and industry. Open source usually refers to a product includes permission to use its source code, design documents, or content for free. Comparing to traditional commercial or “closed” software, open source tools provide reproducibility of knowledge, open access of data, adaptability to similar applications, affordable cost, and they are usually contributed by a community of people (Singleton, Spielman, Brunsdon, & Singleton, 2016). The Leaflet API is a leading open-source JavaScript library for mobile-friendly interactive map visualization, and it provides us a powerful set of mapping features. Compared with other online mapping application such as ArcGIS Web App Builder, Leaflet is more lightweight, customizable and extendable. In addition to basic functions and map visualization features, it also has extended open-source plugins which allow you to customize your own application easily and at no cost. We can also integrate it with other JavaScript libraries such as D3.js to achieve better visualization results and functionalities. This tool provides basic map visualization functions for different SNAP-Ed qualification layers, functions for determining nutrition education site eligibility, and an info box updating site qualification information. Details on the application Leaflet has detailed documentation and fundamental hands-on tutorials helping you get familiar with the API. For those unfamiliar with JavaScript and HTML, w3schools is a good place to learn such web technologies. Since Leaflet is code based, we also needed a robust text editor, such as Sublime Text or NotePad++. Since we can only create customized map vectors from GeoJSON objects, we also need to prepare our geographic data into GeoJSON format. GeoJSON is a lightweight and straightforward format for encoding a variety of geographic data structures and it’s also a common format for geographical data in Javascript. There are many tools available online to convert ESRI shapefiles to GeoJSON such as Mapshaper, and you can also do it natively in QGIS. Our web tool has five fundamental features:
Basic functions such as adding basemaps, layer controls, and adding info window are well-explained in the tutorials and documentations. For me, the major challenge of this map was determining site eligibility and creating the Geo-locator. While Leaflet is a powerful map visualization API, it has limited features on spatial analysis functions. Luckily, we have plugins contributed by other people to realize those functions. This is one of the many advantages of open source software. To determine whether a point is intersected with a layer, we used the “Leaflet-pip” plugin which provides us point-in-polygon calculation support. For the Geo-locator, we used “Leaflet GeoSearch” plugin which is an easily extensible plugin supports address searching and real-time geocoding in Leaflet. This web tool is hosted on GitHub’s online repositories using GitHub Pages. GitHub is an open source web-based version control hosting service, it is free and very convenient for project collaboration and distribution. Click on this link to see it live. For more detailed information and actual code, please visit the GitHub page on this project. 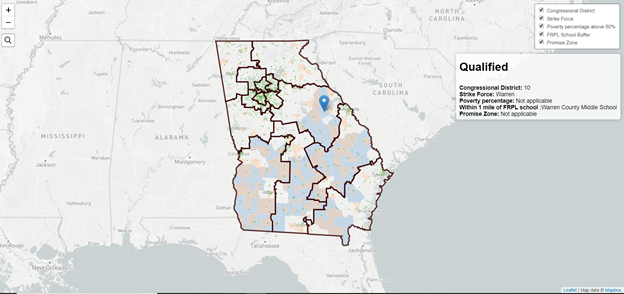 Conclusions
Overall, this web tool using geospatial data can help UGA SNAP-Ed determine nutrition site eligibility more efficiently without communicating with GIS experts. The GitHub repositories can also help UGA SNAP-Ed manage the tool in the long run. Also, the open source code and public accessible data can be easily extended and replicated for SNAP-Ed in other states. Although Leaflet has many advantages compared with other commercial platforms, it still has some drawbacks: it requires a basic understanding of JavaScript and HTML languages and it is also relatively weak on spatial analysis functions. One thing worth mentioning here is that even though we provided this tool for UGA SNAP-Ed program, they seldomly used it due to various reasons: First, they still feel better having GIS experts directly confirm eligibility manually. Also, the map is not an adequate stand for specific circumstances. It raised my concern that while our lab has talked a lot about Public Participatory GIS and Community GIS, how to gain public acceptance and further public engagement to it still remains a question. References
Author Yangjiaxin Wei is a first year Ph.D. student at the University of Georgia in the Department of Geography. Comments are closed.
|
Archives
April 2024
Categories
All
|

- Home
- About
- Activties
-
Projects
- Athens Wellbeing Project
- ACC Black-owned businesses
- Athens bike routes
- Atlanta Community Food Bank
- Athens 1958 City Directory
- Athens bike routes
- Brooklyn Cemetery
- Evictions in Athens
- GA Hunger study: Proximity map
- Georgia Initiative for Community Housing
- Historic Cobbham Neighborhood
- Inner East Athens
- Hot Corner
- Linnentown
- Sparrow's Nest
- Blog
- Resources
- Calendar
 RSS Feed