Exploring the boundaries of esri's web appbuilder: a reflection on what i lost and what i gained3/31/2019
Aileen Nicolas As the saying goes: you can’t have your cake and eat it too. In a project for the Community Mapping Lab, I worked with a representative for the United Way of Northeast Georgia’s 2-1-1 program to develop a web application that allows for visual interaction with services offered in Athens, Georgia. Along the way, I had to weigh the pros and cons such as reproducibility and ease of use of different web application development software. I found that it was impossible to have everything I wanted in a single web framework for software development. The United Way of Northeast Georgia is a non-profit organization that aims to ensure access to quality education, financial stability, and healthy lifestyles for residents of its service region. They work with stakeholders from different sectors such as schools, businesses, financial institutions, and local governments across the state to promote and improve community conditions. Their 2-1-1 program offers residents the opportunity to speak with or text a representative of United Way about services they may be looking for. In the fall of 2018, I worked with a representative for the United Way’s 2-1-1 program to develop a web application that allows users to locate services offered in Athens, Georgia through a map interface. Although the call line offers callers the ability to speak with someone who is knowledgeable about the services offered, a web application allows users to explore services at their own pace and see details about the services up front as opposed to hearing about them over the phone. The web application had 5 important requirements:
I looked for ways to meet the requirements listed above, managed data from United Way’s database, and researched the best way I could develop a web application. I did this through an internship with the Community Mapping Lab which actively works to provide students with the opportunity to work with community members as well as apply their knowledge to solve practical problems. It is important to carefully consider which software to use when developing a web application. In the development process of this web app, I considered using Leaflet or R Shiny. These programs would allow me the greatest flexibility in the development of the application, and it would be shareable for future use as well as reproducible. However, I don’t know JavaScript, so I couldn’t make a Leaflet map, and at the beginning of this project, I had no experience in R. To develop a web application using those tools would be to embark on a long journey of learning for which I did not have time. I chose to use ESRI’s Web AppBuilder to develop my web application because it was the best tool for me considering my skill set and complete lack of coding experience. I was able to develop a web application with unique visualization features and useful filtering tools. With this app, the users could explore the agencies in Athens, search for service by language availability, visualize the route(s) agencies are on, access contact information, and determine eligibility. One of the advantages of my web app is that all agencies which offer services for the general public are listed on its map. Unlike Google or other search engines, the web app shows all the services available from all service categories at once. Google is more likely to display agencies whose names match the keywords input in the search bar. Some of the agency names are not representative of all the services they offer, and because of that, a search engine can be limiting. Additionally, a search engine may not offer as much information as clicking on one of the service icons on my web application may offer. For example, by clicking on a service icon, I can see all the information shown in figure 1, and more. 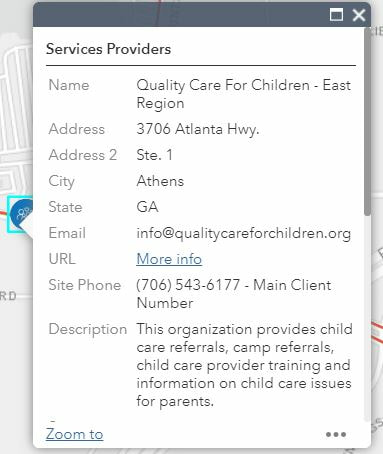 Image 1 In a previous blog post, Jiaxin developed her own web application using the Leaflet API to map areas in the state of Georgia that had high percentages of population eligibility for UGA SNAP-Ed programs. Like her, I wanted to develop a web application that allowed users to explore services and visualize eligibility geographically. I know about the importance of using open-source software for reproducibility of a project. I know that ESRI products are expensive to license and thus difficult to access for those who do not have hundreds of dollars to spend on licenses. So why did I choose the Web AppBuilder? In the end, we have to pick our battles. My app may not be easy to reproduce, but it had the basic features I needed. I wrote instructions on how to download data from United Way’s internal database. I used R to write scripts to prepare the data I had extracted. Even though I was not able to complete this entire project in a way that promotes accessibility to the entirety of my work due to limitations in my knowledge, I gained the skills that could help me produce a Shiny app in the future. It is interesting to consider how “open” open source data or software is if it requires a significant amount of time, knowledge, and experience to be able to use it. Some features I wish I could have expanded on with ESRI’s Web AppBuilder were fonts, the flexibility in positioning of certain elements and widgets, and further customization of widget features and capabilities (Figure 2). For example, the text below the filters blended in with the background of the filter widget, and I wish I could have chosen a darker color for the text to help it stand out. Additionally, I would have liked to have the legend be on the other side of the web application to allow users to more easily find that button. Finally, I had a difficult time with the filter feature since it only took data in the wide format instead of the long format. These are the sorts of limitations that we can experience when we don’t code our own applications. In conclusion, in developing a web application for United Way, I made the decision to use ESRI’s Web AppBuilder over R Shiny or Leaflet. There were benefits to ESRI that made developing the web app easy, but I missed out on the flexibility associated with coding my own web application. I struggled with the limits of the ESRI’s Web AppBuilder but learned valuable new skills that I can use to promote more reproducibility of my work in the future. 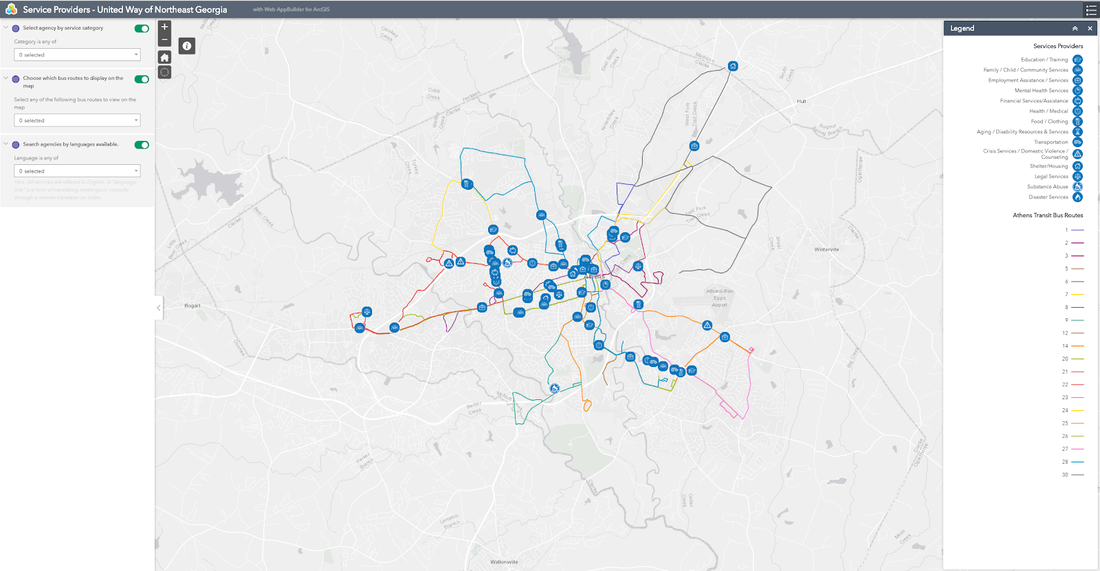 Image 2 AuthorAileen Nicolas is a fourth year Geography major at the University of Georgia. She will be pursuing her Master's degree in Geography starting this fall of 2019 also at UGA. Comments are closed.
|
Archives
April 2024
Categories
All
|

- Home
- About
- Activties
-
Projects
- Athens Wellbeing Project
- ACC Black-owned businesses
- Athens bike routes
- Atlanta Community Food Bank
- Athens 1958 City Directory
- Athens bike routes
- Brooklyn Cemetery
- Evictions in Athens
- GA Hunger study: Proximity map
- Georgia Initiative for Community Housing
- Historic Cobbham Neighborhood
- Inner East Athens
- Hot Corner
- Linnentown
- Sparrow's Nest
- Blog
- Resources
- Calendar
 RSS Feed