
|
By Matthew Thurston, Community GIS student in Spring 2023
This semester, I have been taking the Community GIS class offered at the University of Georgia. This class is designed to introduce students to how GIS can be used effectively to engage with a community. Before taking this class, my experience with GIS work was limited to producing maps made specifically to be turned in for a grade. I was excited to see this course offered, as it sounded like the perfect experience to give back to the local community after going to school here and also get to use GIS skills for something greater than just producing a map to turn in. Helping the local community is important, especially through work done through the University of Georgia, as I feel so often that the university is not concerned with the local community and instead worries only about what happens within the confines of campus. Throughout the semester, we have learned a variety of topics, but we have been working on two major projects for the majority of the class. Our first main project was concerned with the Brooklyn Cemetery in Athens, Georgia. Brooklyn Cemetery is an African-American Cemetery, and houses many ancestors of people still living in the area. We worked closely with the local community, especially the Board of Trustees for Brooklyn Cemetery and Linda Davis. Hearing her talk and her enthusiasm for this project made me realize the significance of the work we were doing. For this project, we had four main goals that we wanted to accomplish. We first wanted to go back through the cemetery to make sure every gravesite was updated and had a correct location assigned to it. Secondly, we wanted to create both a printed map and an online map that would show the location of the gravesites, as well as other important features. In conjunction with this, we wanted to also create section markers for the cemetery. Finally, the creation of metadata was required in order to make the data of Brooklyn Cemetery organized, and to preserve the data for any future work done on the cemetery. In order to accomplish these tasks, the class split into four groups. My group was tasked with creating the online and printed maps. Additionally, I assisted in the data gathering and cleaning, as this was crucial in producing our accurate maps. In order to do this, we used Field Maps as well as the ArcGIS Map builder online. It was a great experience working in conjunction with everyone. Everyone knew their role, and completed their jobs. Seeing the finished products reminded me that we were doing something much bigger than just producing a map. Compared to GIS classes of old, we were simply given the data already made for us, and then went about producing a map or product. However, here we had to collect the data ourselves. This process was new to me, and something I had not done before in my previous classes. Additionally, this data and map were related to the local community. In projects past, the work we created was usually for maps that had no relation to Athens or any surrounding community. Additionally, this map we were creating would be used by people for years to come. In previous classes, the maps I had created were never really published and had little bearing on anyone. For our second project, we have started work on eviction mapping. This is a joint project being done with the help of the Athens Housing Advocacy Team. The Athens Housing Advocacy Team (AHAT) is concerned with fighting for the right to affordable housing in Athens, Georgia by working and building relationships with renters and other allies in the city. Before this project began, I had no idea that there was such a large problem of eviction in Athens. I knew that rent was increasing in Athens, but I figured that was mainly just in the downtown area of Athens, where a bunch of students live. I had no idea that there were companies buying up large swaths of property in Athens and forcing out residents by declining Section 8 vouchers and driving rent prices up as inordinate amounts. In order to prepare for this project, we read some pieces about situated mapping, critical mapping, and other anti-eviction mapping projects. These pieces were a good introduction into this large topic, as beforehand I was very unfamiliar with segments of it. We have just begun to get into the real work for the project, but I am excited to dive deeper into it. This work seems like it could help the local community greatly, so I am eager to see what we can do in the rest of our class. Overall, this class has taught me the impact that GIS and mapping can have. GIS can be more than just plotting points on a map. Instead, real community work can be done, which involves deep collaboration with the community to produce results that will help them positively. This can be done by talking to local community members, perhaps in meetings or assemblies. By talking to community members, you can sense what issues really plague them, and then develop a plan to help them. I enjoyed that aspect of the Brooklyn Cemetery project, as we listened to what the community wanted and tried to incorporate it into our project. In the next few weeks, I am eager to begin to work more on the eviction mapping project. We have had guest speakers talk to us about the issues faced, and hopefully these issues can be remedied. Looking forward to the far future, I hope I can use the skills learned in this class to keep working for my local community
0 Comments
Mase Shepherd, Community GIS student in Spring 2023
Course Summary The first half of Community GIS began with a project associated with the Brooklyn Cemetery in Athens, Georgia. Despite housing many individuals and families with generational occupancy in Athens, this African-American cemetery, as a result of the deep south’s close ties to racism, prejudice, and slavery, has been historically neglected. The trustees of the cemetery, called the Friends of Brooklyn Cemetery, have been working over the years to bestow rightful dignity and honor to their loved ones resting here by improving the cemetery’s overall state. Working in accordance with Dr. Jerry Shannon, the Community GIS instructor, and Linda Davis, a representative from the Friends of Brooklyn Cemetery, our class worked as a team on various projects to fulfill goals we set to improve the cemetery, which included organizing the cemetery into sections, laser-printing section signs, cleaning and speculating existing data of those buried at the cemetery, locating the gravesites of individuals and families in GIS, creating physical and online maps of the cemetery with GIS, and documenting all metadata and processes used to do so. Currently underway, the second half of Community GIS involves working on an eviction mapping project with the Athens Housing Advocacy Team (AHAT), analyzing Athens’ eviction data to ultimately uncover eviction trends that may support local tenants, encourage future eviction prevention programs, and advise relevant policy. Reflection Up until the beginning of Community GIS, although I never considered myself an expert by any means, I thought I possessed a relatively well-rounded idea of what GIS was and what it meant to do GIS. But, as I now understand, there existed a branch of GIS methodology I had not yet been introduced to. I must note, Community GIS has certainly enhanced my technical GIS abilities, in addition to the introduction of new ones. We used ArcGIS Field Maps – a phone application allowing one to access and add data to online web maps made in ArcGIS Online – which I had not done before. We used this tool on-site at Brooklyn Cemetery to gather point data with attribute queries for individuals’ gravesites. We made a searchable web map for the Brooklyn Cemetery using ArcGIS Online’s “create app” tool – a feature that can export interactive maps for public, user- friendly use on media platforms – which I had also not done before. This app, once published on their website, will allow Brooklyn Cemetery visitors to search for, locate, and give regards to friends or family buried at the cemetery. With the recent initiation of our second project with AHAT, we practiced heat mapping and point pattern analysis and aggregation mapping using eviction data in both ArcGIS Pro and QGIS which, again, I had not done before. These few examples represent some of the tangible GIS skills and concepts learned from class and projects, but they do not represent my most valuable takeaway thus far. What I value most comes from Dr. Shannon’s guidance on Community GIS theories and methods in lecture. I never studied GIS in a social environment nor received any form of GIS ideology or philosophy, and I never thought of the importance of such theory in a seemingly rigid discipline that operates on numbers, statistics, and data. However, there is much more to GIS than producing maps and models. This class urged me to think about meaning behind GIS when working with a community, reminding me to reflect on purpose and empathize with those involved. This sense of purpose and feeling of emotional connection through GIS resonated with me, as empathy and emotion resonates to some extent within all of us. With the latter in mind, we also learned that when you do GIS with or for people, you can derive and employ qualitative data along with quantitative data, and I found weight of this new concept. Consider rhetoric, which comprises 3 branches – ethos, pathos, and logos. Rhetoric is a powerful tool that induces change through persuasion. Rhetoric is ingrained in science, used to observe change, study change, relate change, change the way we think, and change what we do or how we act upon something. I think science tends to operate on ethos and logos alone, with ethos usually assumed as a given, and logos the reviewed, repeatable methodology that supports the theory. These two branches of rhetoric drove all of my previous GIS studies. Contrarily, Community GIS taught me to consider pathos when doing GIS, as well. As I mentioned, GIS can be carried out with qualitative data, rather than just quantitative, using audio files of personal accounts attributed to point datasets or pictures and videos from community members linked to a map, for example, which can inspire empathy. This is significant because pathos is an equally important third branch to rhetoric, and including it via qualitative data in GIS can strengthen rhetoric, thus strengthening the power to change. And, when scientific methodology, data, and GIS coalesce, this strengthened power to change can be better used to help improve the human condition. By Casey Serrano, student in Community GIS Spring 2023 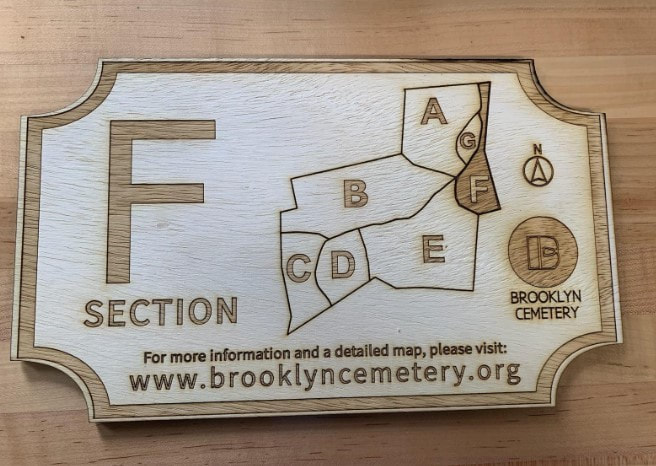 This past week I finished laser-cutting and engraving the section markers part of our class designed to be placed at path intersections in Brooklyn Cemetery, a historically Black cemetery in Athens that was started in the aftermath of the Civil War to provide a respectful final resting place to Black Athenians. Unfortunately, the cemetery was abandoned for decades, and it has takenthe work of several trustees, most notably Linda Davis, to restore the Cemetery from an overgrown state. The Brooklyn Cemetery did have wooden section markers, but they were old and many had fallen off of the trees they were nailed to. With our class’ maps, my connection to the Shirley Mathis McBay Library Makerspace as a student worker, and funds from the Geography department, it was very easy for our group to create new markers for the Cemetery, and in a matter of weeks there will be markers with maps of the Cemetery that are sealed and stake in the ground so that visitors can navigate more easily. The Makerspace is open to any UGA-affiliated patrons of the library for free, and UGA students or staff could revisit this project to replace or update the section markers in the future. I want to use this blog as a place to explain the process of making the signage in detail, and provide some insight into how the process could be improved for the next round of markers.
At the most basic level, making these markers was fairly simple since all we really needed to do was design them, break the design into cut, engrave, and stroke files, use the laser cutter, seal the signs, attach them to signposts, and drive them into the ground. The Makerspace offers classes on laser cutting that are sufficient to prepare a group to use the cutter, and the sealing and implementation of the signs is not a very difficult process. As long as future groups do not want to re-do the signs and their design, the files for creating new ones are available in the Google Drive from this class and can be reused. With some support from the Makerspace, this is a project that any UGA affiliated group, even one not comfortable with mapping, could do. The most difficult part for future groups that are interested in re-doing the signs will probably be the design process. Designing new signs to reflect updated sections, a desire for more information, or to use a different material would be simple, but creating a design that is compatible with the Makerspace’s lasercutter is more difficult. For the signs to be as legible as possible, it is best to engrave the design and then use the score setting to add extra deep and dark lines around the outside of the engraving. Scoring can be used for many things, but for this project it is functionally an outline. Due to technical limitations of our lasercutter’s software, the engraved image must be stored as a raster png file, but the score image must be stored as a vector svg. This is due to the way the machine processes different kinds of images to guide it to either laser larger areas for engraving or very precise lines for cutting and scoring. For a project like this that necessitates creating many similar files with just a few elements changed, it is also important to use one template so that all of the section markers look uniform and the scoring outlines perfectly match the engraving. For our project, we created the original template as a psd (Adobe Photoshop) file, which had some advantages as we were able to use the many design tools available in Photoshop. However, what I realized when I began trying to cut the designs was that the psd files were exporting missing elements when exported to svg files because not all of the elements in the Photoshop canvas were actually vector objects. Photoshop is primarily a raster environment while Inkscape (link here) is primarily a vector environment. This meant that I had to convert all of the elements to vector objects and recreate the design in Inkscape in order to create an editable template that could export well to pngs and to svgs. I would advise future designers to create all of their designs in InkScape or another vector environment from the beginning. Another potential consideration for future groups would be sign material. For budgeting reasons, our group decided to use ¼” Birch plywood that we will treat to be weather resistant. However, there are other, potentially more durable materials that can be put through the laser cutter. Acrylic and anodized aluminum are both materials that can be used in the laser cutter, and with more budget would make good candidates for signage that will not age as poorly as wood. A final consideration for future groups would be to collaborate more with the Brooklyn Cemetery trustees and community. Due to the short time frame of our class, it was not possible for us to work in concert with community members, but I think given more time this would have been a great opportunity to invite local artists to collaborate with us. The cemetery has iron gates, created by a local artist, that depict scenes symbolizing themes of knowledge, religion, and life. I think a project that integrates design elements of the gates into the section markers would be a good option for a future group. By Lan Nguyen, student in Community GIS, Spring 2023
As my time at the university comes to a close, I’m reflecting on my experiences in GIS, even though self-reflection is a generally difficult process for me. I began with an Introduction to GIS course at Georgia State University. After I had transferred to the University of Georgia, the next introductory course I enrolled in was Aerial Photographs and Image Interpretation. These courses taught two software programs: ArcGIS Pro and Google Earth. Through those programs, we applied direct step-by-step instructions with finite answers. Each student resulted with the same conclusion and final map, aside from some personal stylistic preferences. At the end of the semester, we would get into groups for a final project and presentation where we would receive little to no feedback and our classmates do not have enough interest to pay attention. We moved through both classes very similarly. It’s an overall average classroom experience, but I enjoyed the meticulous and intricate process of ArcGIS enough to continue toward a certificate. Aerial Photography in Forestry, taught by Dr. Bettinger, and Community GIS, with Dr. Shannon, are the two last courses in GIS that will complete my certificate. Dr. Bettinger’s course turns the introductory Aerial Photographs and Image Interpretation course into a more specialized concept. I’ve learned practical concepts and interpretation skills that I never knew of before that follow along with US Forestry Service or National Park Service rules. These skills can interpret the difference between deciduous and evergreen forests, and takes another step further by identifying the possible species of the trees based on the regions the images were taken. He manages to capture the class's attention by sharing his own experiences when he was a student or intern for forestry companies. I appreciate these insights since I’m currently applying to internships myself for the next year. They often feel like a glimpse of what my career could look like, even though that’s the path I am unlikely to follow. Dr. Shannon’s course follows a completely different route compared to all three of my other courses. His style and method of teaching are similar to mentorship or internships, except that it is for a class instead of a small group. It’s as if he’s the one that’s the passenger giving map directions and we are in the driver's seat doing the “work”. I want to say “work” in a light manner where we cannot take all the credit. Dr. Shannon is the head of the projects while we facilitate them. We take what we have learned through previous GIS classes, and we apply them here in our projects. During the week Dr. Shannon had to be out of town, I was surprised to find that the class followed the schedule as usual. We had students that took on to be class leaders in a way, we continued with fieldwork in our own times, and we never lost track of progress. If this was any other class, we would have had the class canceled or been assigned remote busy work. The amount of interest the class had for the Brooklyn Cemetery project was different from the other kinds of projects I had worked on in my previous GIS classes. I believe the fact that we had a strong, established, and local relationship with the founder Linda Davis encouraged us to keep working on the project. I loved locally working with the Brooklyn Cemetery. There was a clear goal that we needed to get to even if it took awhile to get there because of the amount of data organization that was required. The metadata organization, at the beginning of the semester, was a concept I had heard of but never truly applied in practice before. In addition, I believe the use of ArcGIS Online, QGIS, and the fieldwork we did at Brooklyn Cemetery was beneficial to establish clear boundaries on a map for the cemetery. I prefer the application process that this class has allowed us to do. I love how this class is a culmination of what I had learned from my other courses into an operation. I can use everything I’ve ever learned for the Brooklyn Cemetery and anti-eviction projects, which is amazing since I’ll be graduating in a few weeks. I hope to apply what I’ve learned from this class to my near-future internship positions. This was a wonderful class to learn from, and I’m excited to see where it will take me on my journey with GIS. By Morgan Mize, Community GIS student in Spring 2023
Before starting college I had never heard of GIS, and if asked I would probably have responded with a similar look of confusion that my peers display when I tell them I’m a GIS major. Yet I have learned so much since then so I would like to reflect on how my knowledge of GIS has changed throughout my time in college. I came to UGA and within my first year changed my major about 3 times before I settled on Wildlife and Fisheries at the College of Warnell. I was happy with my choice until Fall of my junior year when I had to take Spatial Analysis of Natural Resources, a class that everyone told me was horrible. Yet instead of dreading the class like most of my friends, I enjoyed the work and found myself constantly helping my friends on the lab assignments. During this semester I decided to add a major called Natural Resources and Sustainability with an emphasis in geospatial. After that I started to really focus on my geospatial major and that spring I did a co-internship with the Athens-Clarke County Geospatial Office and Keeping Athens Clarke County Beautiful (KACCB). This internship was my first experience in GIS applications outside of natural resources. During my internship I learned about ArcGIS Online and discovered just how broad GIS applications can be. This was my first experience in which I got to learn how GIS applies to the community. My own project was focused on helping the community find and report information relevant to the Adopt-A-Highway program. This semester, Community GIS has given me a chance to once again use GIS to help the community. The biggest difference with this class versus my past experience is that the need for GIS comes directly from the community. Before the work I was doing was based on what my supervisors at KACCB wanted so that KACCB could create a better chain of communication with their volunteers but I personally never interacted directly with the community outside of the KACCB and geospatial office. In contrast the two projects we are doing with this class allows for direct interaction with the community with a specific need. Not only is the method of communication different in Community GIS, but this class has taught things in more of a real world context application then any other class I have taken. For example Community GIS helps people in the Athens community that have a current problem and are searching for a solution in the present. In my other classes the teaching methods tend to always use old or fake data with a set of instructions to get an expected final product that matches the professor’s answer key. The different teaching method helps me to correlate what I am learning to a long term purpose besides an A on this week’s lab assignment. Instead of following the bulleted points meant to walk me through a fake analysis that I will forget the following week, this class allows me to understand how to use and work with raw data. In contrast to other GIS classes, Community GIS is unique because the work is all done for a reason with learning occurring along the way. Overall this class is very unique compared to any other UGA class. I find this to be an interesting experience as I take it alongside another service learning class. While this class works together to achieve goals to benefit the community, my other service learning class is made up of smaller groups working directly with a single property owner. Taking these two classes alongside each other has shown me different perspectives of how one can use UGA knowledge to provide a service to another. In my opinion working with the community requires a more in depth analysis concerning not only the goals, but also looking at why this is an issue to begin with. This then leads into issues involving population demographics and even prejudice towards low income. While my other class is more surface level in which the priority is implementing a plan to help the property owner generate income of some kind. In Community GIS, the relationship with the community is much more delicate in which one has to take into account the emotions of the individuals in the community. While I didn’t start my college journey knowing GIS, I am ending it knowing more about it then I ever thought I would. The past semesters have shown me the wide range GIS has in our world. This class has given me a very different perspective on the impact GIS has in a community. While I still see myself pursuing a career using GIS in natural resources, I believe I can bring with me key takeaways from this class to my future career. For example I believe this class has given me insight into the importance of a client’s emotional connection. For example the history or memories made at a piece of property might mean more to a client than a management plan for timber. I believe that the area of natural resources tends to be more detached from the emotional connection of clients, but I can see how it would be imperative to understand why a client might want to preserve certain areas of land based on emotional rather than textbook reasoning. Whether that reason is because of the client’s memories or history, the emotional connection is something that still needs to be addressed and shows that what the client deems valuable might not always be numbers on a spreadsheet. |
Archives
June 2024
Categories
All
|
 RSS Feed