
|
By Constanza Urresty Vargas, Community GIS student Spring 2023 Community GIS is a service-learning course in the Department of Geography at the University of Georgia, where students from different backgrounds and from different years (both undergrad and graduate) converge. This means that as students, we come to the course with diverse skills, knowledge, and interests; although we are all in the same class, we are not learning the same things or in the same ways. During the semester we have engaged in two projects, contributing with GIS tools to local community organizations. The first was with the Friends of Brooklyn Cemetery, a local organization in Athens that works for restoring and rebuilding this cemetery, which is a resting place of former slaves. Their aim is to commemorate the individuals laid to rest there and bring their stories to the present. For the second project we have been working with the Athens Housing Advocacy Team (AHAT), a grassroots activist group that collaborates with renters and allies to fight for the right to affordable, healthy, dignified, stable housing as a human right. Course activities have involved lectures, mapping, discussions, and sessions with several visitors talking about their experiences as researchers, practitioners, or organization members engaged in issues related to the projects. We also had various class discussions attempting to reflect on the purpose and meaning of our work as a class. What do we want to achieve in our projects? Why mapping? How are we contributing to community organizations through maps? Many of these discussions involved collective agreements about the goals of our work and how to address our questions. So, this is a lot about “we” and “our”. Most of the course activities were collective, not individual. In my opinion, this is particularly meaningful, as many of us enrolled in this course because we think community is important. Community mapping processes need skills for working with, thinking with, and learning with others. Co-learning and knowledge co-production is what allows us to be co-producing maps. As an international student in my first year in UGA and in the U.S., collectivity has been vital for my academic experience. Particularly in the Community GIS class, collectivity has been important for my learning process and for contributing to our projects. This is a community-engaged course, which means we are collaboratively working with local non-academic organizations or community members. Consequently, it requires an understanding of the context of these organizations/communities and learning about the problems they are facing. 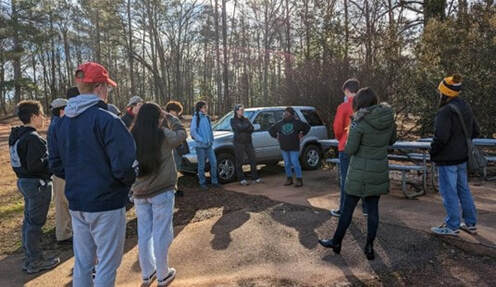 Community GIS class at the Brooklyn Cemetery, in a meeting with Linda Davis (co-founder of Friends of Brooklyn Cemetery) Community GIS class at the Brooklyn Cemetery, in a meeting with Linda Davis (co-founder of Friends of Brooklyn Cemetery) In the case of the Brooklyn Cemetery project, it was necessary to have some understanding about the history of both Athens ant the U.S.; it demanded familiarity with the past in this place, the role of slavery and how this shapes the present in diverse and complex ways. Furthermore, Athens eviction project requires understanding about the social context of housing access in the city, some basics about the housing and eviction legal framework in Georgia, and additionally understanding the nature of available data from local institutions and organizations. All these issues might seem simple, but they are not when you come from a different context, history, and culture. This means new administrative structures, specific concepts, and sometimes different worldviews and social problems. Even more so when you approach these issues not in your first language.
This can be complex and challenging, maybe unfeasible in a short time for international students, as we usually have lived a short time in the U.S. when starting a study program. In those conditions the course might be difficult, as it is highly contextual. However, rather than being an obstacle, all these issues become an interesting and meaningful learning process thanks to the collective. I’m not an individual foreign student navigating an incomprehensible context and struggling to complete the course work. I’m part of a collective, where different knowledges and skills contribute to a common project. Listening to others, being part of group discussions and asking many questions to my classmates is how I could gain some understanding about these issues and shed light on how local communities address their projects. Collaborative and supportive relationships inside the classroom are what makes room for foreign students. It allows us to be part not only of the classroom community, but also the Athens community. This creates space for us, it opens the opportunity to learn from local communities and organizations, while contributing with our work. Sometimes we can also contribute with novel perspectives. coming from the amazement of observing and knowing a new place. While learning from other students about local context, as international student I can contribute with viewpoints as an outsider, which although has some drawbacks, it might be a “fresh” view, in some cases complemented with experiences from different contexts as well. From this perspective the “co” prefix becomes applicable beyond community GIS. This means as a class, we are collaborating not only when creating maps with organizations outside academia (which is the key in this class), but also when doing collective work, co-learning, and co-producing knowledge inside the classroom. Community mapping becomes an intertwining of relationships of collaboration occurring inside and outside the classroom. Community mapping is not only about mapping, but also about collective learning and knowledge co-production, where different skills, knowledge and ideas have a space.
0 Comments
By Nathan Castro, Community GIS Student in Spring 2023
Beginning my college career I decided to choose geography as my major simply because of the fact that I enjoyed Earth and atmospheric sciences, not knowing what else was waiting to be uncovered. Passing through my freshman and sophomore years at school I was pleased to dig into the material and content I have known and heard about since high school: tectonic plates, geology, weather systems. It wasn't until my spring semester of sophomore year that I decided to take my first course in geographic information science (GIS). I have heard about what GIS was briefly before but did not truly understand the magnitude of its implications. Growing up in my hometown, some of my friend’s parents were GIS analysts so I knew the study was something practicable and enjoyable. Taking that first class, I was hooked on the content, combining my interests of computers and geography! I felt as if I gained a lot of new knowledge out of that intro to GIS course as our professor shared with us his point of view on not only the various programs but also his real life experiences. I remember being told that GIS is an extremely versatile skill that could be paired and applied to practically any discipline. This at first shocked and excited me since up until then, most of the work we had been doing were tutorials in ArcGIS Pro on how to utilize the program’s features. I had far off ideas of what I could personally use GIS for but still felt a disconnect of what meaningful work could really be done. Fast forward to the Spring semester of 2023, I am currently enrolled in the Community GIS Service Learning Course at the University of Georgia. I will be honest, during the registration period, I did not know what a service learning course was or what to expect from one. I had assumed that we would be learning more about using ArcGIS or QGIS but with more emphasis on community problems like traffic or resource management. I would soon come to realize what a service learning course entailed: learning and gaining real world experience and reflecting on those after having performed services to a community. This was not going to be a course of rote learning functions on a computer, this was going to be applying all of the skills I have accumulated over the years to help Athens residents and I was very excited to finally be of use to the community. The community GIS course this semester had been split into two major projects. The first taking the time span of the beginning of the year up until the beginning of March was our work with the Brooklyn Cemetery here in Athens, GA. Many people might not know too much about or even recognize the name of this cemetery as it had been abandoned and unkept for many years, but this place is of great importance to the Athens community as it holds many African-American ancestors of the present generation. Our professor had gotten a hold of the founder of the Friends of Brooklyn Cemetery organization, Mrs Linda Davis, to come talk to our class about the history and importance of the cemetery. This was an eye-opening experience hearing Mrs Davis speak about her connection to the space as a site of remembrance to the community but also herself personally. She herself is so passionate about maintaining and improving the cemetery that if our class could only do enough to assist her in her endeavors, then it would be a very rewarding experience and a success for the class in my eyes. Realizing that GIS could improve Athens changed my view of myself from a student, to a GIS analyst. The class was split into groups to tackle multiple tasks to benefit Brooklyn Cemetery. Some groups were asked to produce new maps of the cemetery grounds, others were in charge of cleaning and organizing data retrieved regarding grave markers, my group was set to produce brand new section markers to post around the cemetery. I was very pleased with this assignment as I could instantly see the value being brought to the community. New section markers would allow for better organization and ease of navigation around the grounds, not only for visitors but also volunteers working to improve the space on community work days. During this process I was able to really get my hands involved in multiple avenues. First we visited the cemetery to inspect the previous markers that had rotten and fallen off their posts to gain an idea of what purpose they served, how many replacements were needed and where they would be placed. Secondly we had the opportunity to create a new design for the markers that could provide visuals and even more information about the cemetery. This was a fun challenge for me since I have not had much experience with graphic design. My team got together and created various mock-ups with different design softwares until we decided on one. Lastly we crafted the signs out of plywood using the UGA Makerspace, a campus resource that provided us access to their laser-cutter and engraver. The final products are something I am proud of as they are a summation of all the various skills I have learned within my time with GIS. This service learning course has been very beneficial to my group working skills as well. Organizing group member’s time and efforts to efficiently get through this assignment has been a challenge but has taught me that the real world is not always so simply laid out. New skills like working with photoshop or a laser engraver have been exciting to learn but I really value the opportunity I had to learn community skills. Managing information between myself, group members and Athens has shown me what GIS can be when implemented with multiple people in mind. Finally seeing in person the impacts GIS can have on the community, I feel like I now have my own instance of providing something valuable through GIS which I wanted since my first intro GIS course. By Casey Serrano, student in Community GIS Spring 2023 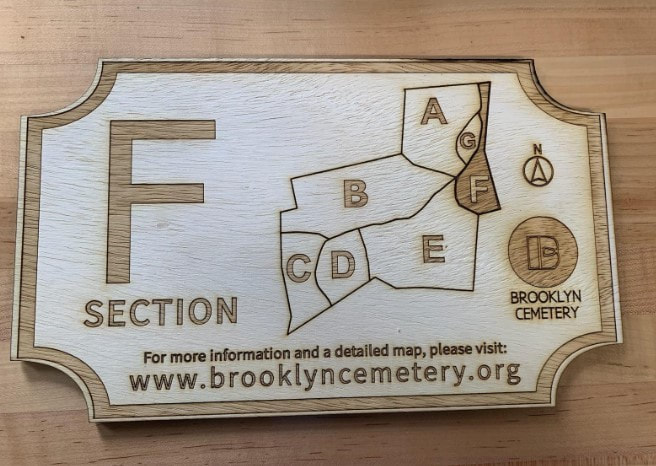 This past week I finished laser-cutting and engraving the section markers part of our class designed to be placed at path intersections in Brooklyn Cemetery, a historically Black cemetery in Athens that was started in the aftermath of the Civil War to provide a respectful final resting place to Black Athenians. Unfortunately, the cemetery was abandoned for decades, and it has takenthe work of several trustees, most notably Linda Davis, to restore the Cemetery from an overgrown state. The Brooklyn Cemetery did have wooden section markers, but they were old and many had fallen off of the trees they were nailed to. With our class’ maps, my connection to the Shirley Mathis McBay Library Makerspace as a student worker, and funds from the Geography department, it was very easy for our group to create new markers for the Cemetery, and in a matter of weeks there will be markers with maps of the Cemetery that are sealed and stake in the ground so that visitors can navigate more easily. The Makerspace is open to any UGA-affiliated patrons of the library for free, and UGA students or staff could revisit this project to replace or update the section markers in the future. I want to use this blog as a place to explain the process of making the signage in detail, and provide some insight into how the process could be improved for the next round of markers.
At the most basic level, making these markers was fairly simple since all we really needed to do was design them, break the design into cut, engrave, and stroke files, use the laser cutter, seal the signs, attach them to signposts, and drive them into the ground. The Makerspace offers classes on laser cutting that are sufficient to prepare a group to use the cutter, and the sealing and implementation of the signs is not a very difficult process. As long as future groups do not want to re-do the signs and their design, the files for creating new ones are available in the Google Drive from this class and can be reused. With some support from the Makerspace, this is a project that any UGA affiliated group, even one not comfortable with mapping, could do. The most difficult part for future groups that are interested in re-doing the signs will probably be the design process. Designing new signs to reflect updated sections, a desire for more information, or to use a different material would be simple, but creating a design that is compatible with the Makerspace’s lasercutter is more difficult. For the signs to be as legible as possible, it is best to engrave the design and then use the score setting to add extra deep and dark lines around the outside of the engraving. Scoring can be used for many things, but for this project it is functionally an outline. Due to technical limitations of our lasercutter’s software, the engraved image must be stored as a raster png file, but the score image must be stored as a vector svg. This is due to the way the machine processes different kinds of images to guide it to either laser larger areas for engraving or very precise lines for cutting and scoring. For a project like this that necessitates creating many similar files with just a few elements changed, it is also important to use one template so that all of the section markers look uniform and the scoring outlines perfectly match the engraving. For our project, we created the original template as a psd (Adobe Photoshop) file, which had some advantages as we were able to use the many design tools available in Photoshop. However, what I realized when I began trying to cut the designs was that the psd files were exporting missing elements when exported to svg files because not all of the elements in the Photoshop canvas were actually vector objects. Photoshop is primarily a raster environment while Inkscape (link here) is primarily a vector environment. This meant that I had to convert all of the elements to vector objects and recreate the design in Inkscape in order to create an editable template that could export well to pngs and to svgs. I would advise future designers to create all of their designs in InkScape or another vector environment from the beginning. Another potential consideration for future groups would be sign material. For budgeting reasons, our group decided to use ¼” Birch plywood that we will treat to be weather resistant. However, there are other, potentially more durable materials that can be put through the laser cutter. Acrylic and anodized aluminum are both materials that can be used in the laser cutter, and with more budget would make good candidates for signage that will not age as poorly as wood. A final consideration for future groups would be to collaborate more with the Brooklyn Cemetery trustees and community. Due to the short time frame of our class, it was not possible for us to work in concert with community members, but I think given more time this would have been a great opportunity to invite local artists to collaborate with us. The cemetery has iron gates, created by a local artist, that depict scenes symbolizing themes of knowledge, religion, and life. I think a project that integrates design elements of the gates into the section markers would be a good option for a future group. By Lan Nguyen, student in Community GIS, Spring 2023
As my time at the university comes to a close, I’m reflecting on my experiences in GIS, even though self-reflection is a generally difficult process for me. I began with an Introduction to GIS course at Georgia State University. After I had transferred to the University of Georgia, the next introductory course I enrolled in was Aerial Photographs and Image Interpretation. These courses taught two software programs: ArcGIS Pro and Google Earth. Through those programs, we applied direct step-by-step instructions with finite answers. Each student resulted with the same conclusion and final map, aside from some personal stylistic preferences. At the end of the semester, we would get into groups for a final project and presentation where we would receive little to no feedback and our classmates do not have enough interest to pay attention. We moved through both classes very similarly. It’s an overall average classroom experience, but I enjoyed the meticulous and intricate process of ArcGIS enough to continue toward a certificate. Aerial Photography in Forestry, taught by Dr. Bettinger, and Community GIS, with Dr. Shannon, are the two last courses in GIS that will complete my certificate. Dr. Bettinger’s course turns the introductory Aerial Photographs and Image Interpretation course into a more specialized concept. I’ve learned practical concepts and interpretation skills that I never knew of before that follow along with US Forestry Service or National Park Service rules. These skills can interpret the difference between deciduous and evergreen forests, and takes another step further by identifying the possible species of the trees based on the regions the images were taken. He manages to capture the class's attention by sharing his own experiences when he was a student or intern for forestry companies. I appreciate these insights since I’m currently applying to internships myself for the next year. They often feel like a glimpse of what my career could look like, even though that’s the path I am unlikely to follow. Dr. Shannon’s course follows a completely different route compared to all three of my other courses. His style and method of teaching are similar to mentorship or internships, except that it is for a class instead of a small group. It’s as if he’s the one that’s the passenger giving map directions and we are in the driver's seat doing the “work”. I want to say “work” in a light manner where we cannot take all the credit. Dr. Shannon is the head of the projects while we facilitate them. We take what we have learned through previous GIS classes, and we apply them here in our projects. During the week Dr. Shannon had to be out of town, I was surprised to find that the class followed the schedule as usual. We had students that took on to be class leaders in a way, we continued with fieldwork in our own times, and we never lost track of progress. If this was any other class, we would have had the class canceled or been assigned remote busy work. The amount of interest the class had for the Brooklyn Cemetery project was different from the other kinds of projects I had worked on in my previous GIS classes. I believe the fact that we had a strong, established, and local relationship with the founder Linda Davis encouraged us to keep working on the project. I loved locally working with the Brooklyn Cemetery. There was a clear goal that we needed to get to even if it took awhile to get there because of the amount of data organization that was required. The metadata organization, at the beginning of the semester, was a concept I had heard of but never truly applied in practice before. In addition, I believe the use of ArcGIS Online, QGIS, and the fieldwork we did at Brooklyn Cemetery was beneficial to establish clear boundaries on a map for the cemetery. I prefer the application process that this class has allowed us to do. I love how this class is a culmination of what I had learned from my other courses into an operation. I can use everything I’ve ever learned for the Brooklyn Cemetery and anti-eviction projects, which is amazing since I’ll be graduating in a few weeks. I hope to apply what I’ve learned from this class to my near-future internship positions. This was a wonderful class to learn from, and I’m excited to see where it will take me on my journey with GIS. By Morgan Mize, Community GIS student in Spring 2023
Before starting college I had never heard of GIS, and if asked I would probably have responded with a similar look of confusion that my peers display when I tell them I’m a GIS major. Yet I have learned so much since then so I would like to reflect on how my knowledge of GIS has changed throughout my time in college. I came to UGA and within my first year changed my major about 3 times before I settled on Wildlife and Fisheries at the College of Warnell. I was happy with my choice until Fall of my junior year when I had to take Spatial Analysis of Natural Resources, a class that everyone told me was horrible. Yet instead of dreading the class like most of my friends, I enjoyed the work and found myself constantly helping my friends on the lab assignments. During this semester I decided to add a major called Natural Resources and Sustainability with an emphasis in geospatial. After that I started to really focus on my geospatial major and that spring I did a co-internship with the Athens-Clarke County Geospatial Office and Keeping Athens Clarke County Beautiful (KACCB). This internship was my first experience in GIS applications outside of natural resources. During my internship I learned about ArcGIS Online and discovered just how broad GIS applications can be. This was my first experience in which I got to learn how GIS applies to the community. My own project was focused on helping the community find and report information relevant to the Adopt-A-Highway program. This semester, Community GIS has given me a chance to once again use GIS to help the community. The biggest difference with this class versus my past experience is that the need for GIS comes directly from the community. Before the work I was doing was based on what my supervisors at KACCB wanted so that KACCB could create a better chain of communication with their volunteers but I personally never interacted directly with the community outside of the KACCB and geospatial office. In contrast the two projects we are doing with this class allows for direct interaction with the community with a specific need. Not only is the method of communication different in Community GIS, but this class has taught things in more of a real world context application then any other class I have taken. For example Community GIS helps people in the Athens community that have a current problem and are searching for a solution in the present. In my other classes the teaching methods tend to always use old or fake data with a set of instructions to get an expected final product that matches the professor’s answer key. The different teaching method helps me to correlate what I am learning to a long term purpose besides an A on this week’s lab assignment. Instead of following the bulleted points meant to walk me through a fake analysis that I will forget the following week, this class allows me to understand how to use and work with raw data. In contrast to other GIS classes, Community GIS is unique because the work is all done for a reason with learning occurring along the way. Overall this class is very unique compared to any other UGA class. I find this to be an interesting experience as I take it alongside another service learning class. While this class works together to achieve goals to benefit the community, my other service learning class is made up of smaller groups working directly with a single property owner. Taking these two classes alongside each other has shown me different perspectives of how one can use UGA knowledge to provide a service to another. In my opinion working with the community requires a more in depth analysis concerning not only the goals, but also looking at why this is an issue to begin with. This then leads into issues involving population demographics and even prejudice towards low income. While my other class is more surface level in which the priority is implementing a plan to help the property owner generate income of some kind. In Community GIS, the relationship with the community is much more delicate in which one has to take into account the emotions of the individuals in the community. While I didn’t start my college journey knowing GIS, I am ending it knowing more about it then I ever thought I would. The past semesters have shown me the wide range GIS has in our world. This class has given me a very different perspective on the impact GIS has in a community. While I still see myself pursuing a career using GIS in natural resources, I believe I can bring with me key takeaways from this class to my future career. For example I believe this class has given me insight into the importance of a client’s emotional connection. For example the history or memories made at a piece of property might mean more to a client than a management plan for timber. I believe that the area of natural resources tends to be more detached from the emotional connection of clients, but I can see how it would be imperative to understand why a client might want to preserve certain areas of land based on emotional rather than textbook reasoning. Whether that reason is because of the client’s memories or history, the emotional connection is something that still needs to be addressed and shows that what the client deems valuable might not always be numbers on a spreadsheet. By Kayla McCartney, Community GIS student in Spring 2023
At the start of the semester, my class begun a collaborative mapping project with the Brooklyn Cemetery. The Brooklyn Cemetery is one of the first African American cemeteries in Athens, GA. From my cursory observation, there seem to be two major kinds of cemeteries. The first kind is the one that remembers and celebrates the people who are buried there. The second kind is the one that people are buried in and forgotten about. Out of sight, out of mind. The Brooklyn Cemetery is an unobtrusive place that would become the second type of cemetery if it weren’t for a few select people fighting for its visibility such as Linda Davis. The purpose of this project was to take all existing data regarding the cemetery and combine and add to them to create a sustainable, informative, and accessible map for those interested in the cemetery. Like many UGA students, I am not from Athens. I am not familiar with the history or layout of much of Athens. Before this project, I had never seen the Brooklyn Cemetery, heard of it, or even driven by it. I had no connection to the Brooklyn Cemetery. So, at the beginning of the project, I approached it like any other assignment: understand what needs to be done, then do it. However, it might be important to understand that while this is a geography class, I am a landscape architecture major, and I approach community engagement projects like a landscape architecture major. A lot of my experience with projects like these has been mostly in the realm of theoretical, and for the few projects actual communities were involved in, they said what they wanted then were majorly hands-off afterwards, somewhat similarly to this project. Something particularly relevant to me that I’ve learned by working more closely with a place like the Brooklyn Cemetery is a better understanding of the attachment to place in people regarding a place I am unattached to. Linda Davis is the most visible advocate for the revival and maintenance of the Brooklyn Cemetery as a historical place. She came and spoke to our class about the cemetery’s historical and emotional significance. As it was established in 1880, only 15 years after slavery was abolished, it was likely many freed people had been buried there. Moreover, there was also a high likelihood her own ancestors were also buried there, which she explained as her strong personal connection. She then expressed to us how strongly she felt about the impact having access to their history and where they came from would have on future generations. These things were significant and perhaps slightly confusing to me because they were things I don’t usually think about. My grandmothers on both sides of my family are Asian immigrants, and in coming to America, they more or less left their roots behind them. Both of my grandfathers have longer histories in the US, however maybe being veterans and not being as close to external living family members has made the history of how we got to this point less important to research or talk about. In my family, there is a much stronger emotional connection to family now than family gone, hence why Linda’s different emotional priorities felt very significant to me. After she spoke to us, my perspective changed. Before, I had no attachment to the Brooklyn Cemetery, and I wouldn’t have necessarily called it important to me. However, after I was able to see how important this place was to Linda and how her connection to her family and roots felt mirrored to my connection to living family, I was able to develop a sense of empathy for this place through Linda’s attachment to the cemetery. More than that, I realized it was important to her. My mind then circled around to the idea that while importance is a relative concept, if looked at objectively, isn’t it universal? I can then start to think, because the Brooklyn Cemetery is important to her, it is important to me. While I don’t know if this revelation truly changes how I approach this particular project, I believe that this kind of awareness of where my values end and another’s begin (how they relate and how to blur the lines) can be greatly impactful for future projects. It is the kind of thing that affects communication, understanding, and empathy which then affect how the project framework develops. When working on community projects, it can be easy to get stuck in the big picture headspace where you have a certain set of priorities and values. It’s easy to think in terms of “What is worth putting time into?”, “What will have the most impact?”, or “How can I best improve [this place] for [specific goals]?”. It’s easy to forget the about the people the change is for. It doesn’t help that many of my projects as a landscape architecture major has us working on community projects with limited if any contact with said communities. In building the world, it shouldn’t be so easy to forget who you are building it for. What I’ve learned from the Brooklyn Cemetery project is that empathy is important. I’ve learned that when approaching projects, I need to come with my ego pre-dismantled. Because at the end of the day, I am not making design or planning decisions for myself. I am making places for people. People cannot be separated from place. So, when making a place, the first question I will ask from now on is who are these people, and what is important to them? By Amber Orozco, Student in Community GIS, Spring 2022 What do you think of when you hear the word “open access” in relation to research or community-based work? Perhaps it brings to mind programs, tools, and academic publications that have no paywall? Or maybe you think of a community that shares resources, such as software code? But in what ways can the approach of open access be a way to support local community organizations? In our Community GIS class, we have spent the last few weeks of the semester thinking through these questions as we work to support the campaign of a local organization, the Athens Anti-Discrimination Movement (AADM). AADM “advocates for racial and social justice and strives to combat discrimination through education and activism”. Part of their efforts includes their “United Against Discrimination” sticker campaign where they ask local businesses to pledge to creating a more diverse and inclusive work environment. If the business decides to participate, they receive a AADM sticker (see photo below) to place on their business’s front window. As a class, our goal is to create a map that will be hosted on AADM’s website, showing the businesses in downtown Athens that are supporters of the campaign. 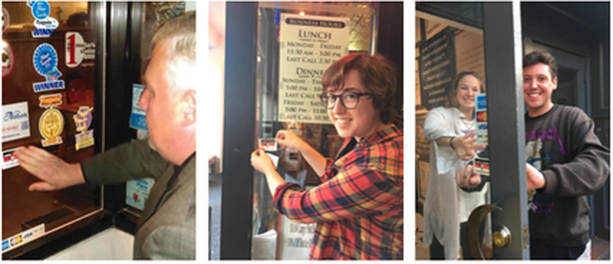 Local businesses in Athens supporting the AADM United Against Discrimination campaign (Photo Credit: AADM) For this project, open access can be understood in two different ways. First, open access for our work takes the form of a process-based approach (Shannon & Walker, 2018), meaning our class is working collaboratively with AADM to gather input on the project, including the timeline, goals, exchange of resources (i.e. AADM provides our class the list of business supporters of the campaign from 2019), and how the map will be both stored and accessed. Our collaboration with AADM is consistent throughout the process, which included us meeting with Denise Sunta (AADM Administrative Assistant and Events/Community Outreach Coordinator and also UGA alumna) at the beginning stages of the project and we will be ending the project with presenting our final map designs to AADM for their approval.
Second, our class is leveraging our technical skills to create this map through an open access mapping program (QGIS) and coding library (Leaflet). Our class was tasked with verifying whether the list of businesses provided by AADM were still participating in the campaign. To do this, our class divided up sections of downtown Athens to assess which businesses had the AADM sticker displayed on their front window. We used ArcGIS’s Field Map data collection application to update this information, including adding new business supporters of the campaign. Our class was able to utilize our university membership to access paid GIS applications, such as Field Map, for this project. Once this list was updated, our class added the geographic coordinates to each business. We were then able to upload this list through excel to QGIS and map out the businesses. Using Leaflet for codes to customize the functionality and appearance of the map, our task is now to develop a map that serves the needs and goals of AADM. Our class is currently divided into different teams, and we are working to develop different options for AADM. For example, my group is working to use codes from Leaflet to develop a pop-up label that will appear when someone clicks on a business that is a supporter of the campaign. We intend to include information on each business, such as the hours of operation, website link, a photo of the business. Additionally, we are developing an option on the map that allows a visitor to filter for the type of business, such as “restaurant, bar, and retail shop”. Once we decide on the format on the map, it will eventually be uploaded and hosted on Github. Personally, this process of transitioning from ArcGIS to QGIS and Leaflet has been challenging because some coding knowledge is required to format the map in my group’s vision. The last time I encountered html was in high school, but I think getting comfortable with these open access programs are a matter of practice and will require more time learning compared to more user-friendly programs, such as ArcGIS. From this experience, I have learned that open access is more than free programs and resources. It can mean leveraging technical expertise as students to support the efforts of community organizations, while engaging the community organization through the process to ensure the organization’s perspectives are centered as the tool becomes developed. Open access extends to the programs we used with no paywall and those programs that we had access to through our university membership. Each of these elements play an important role when partnering and supporting the GIS work of community organizations. By Miles Montello, Student in Community GIS, Spring 2022 ...ranked in no particular order, here are five new nuggets of information that stuck out to me since starting this class in January of 2022... 1) Know how to plan a task with a group In my experience, the group projects that go the most efficiently are the ones where there’s one dominant person who is the most passionate about the task and can get the less passionate group members smoothly convinced of their vision early in the timeframe given. Groups where all the members are either too shy or too indifferent wind up with a wishy-washy concept of a final product and it’s awkward for everybody. If there are two dominant people with conflicting visions then their egos may clash, but usually a resolution is reached early on. Just because there’s a space for someone to step up doesn’t mean anybody necessarily will- until the deadline gets close enough that either someone caves in or everyone comes to an agreement. In my opinion, it’s apt evidence for the 80-20 rule, which is a principle that says that roughly 80% of consequences come from 20% of causes- 80% of the work/planning is done by 20% of the participants. Clearly defining tasks from the beginning makes it the least stressful, and the tasks don’t even necessarily need to be divided equally because the quality of every member’s work is proportional to how invested they are in the topic. I’m proud of my group’s contributions to the Linnentown Storymap, which was a web map the class produced describing a black neighborhood in Athens doomed by Urban Renewal to be replaced by freshman dormitories. Each group of 4-5 students were given a section to create on our own. I would describe the first half of our time given as sheepishly figuring out what we should do, the second- executing the original agreed upon vision which was subsequently revised, and the last fifth- creating most of what would be on the final product. 2) Teams make monotonous tasks go quicker This lesson from the class also applies to life in general. Having multiple people assigned to a creative task as opposed to one or two people creates the awkward scenarios I previously described. On the other hand, if you have human capital, having multiple people assigned to a clearly defined repeatable task that is too big for one person is super-efficient. I recall Dr. Shannon remarking on how the task of geolocating all of Athens’ downtown businesses on the AADM list (of which there were around sixty) would’ve taken hours for one person to do but was shortened to two minutes by each student being assigned four businesses to add coordinates to on a shared cloud document. If you tell a random set of eight people to paint a twenty-yard wooden fence a certain color or pattern, it’s going to be finished in an hour or two if they have the materials. If you tell them to paint a mural on the fence, it’s going to take way longer and the result will have very noticeable gaps in artistic ability between the painters. 3) Text mine efficiently The 1958 Athens City Directory existed only as a physical book, yet the Community Mapping Lab was working to digitize the information listed inside- from names, addresses, occupation, race, home ownership, etc. To do so, the entire directory was scanned- but to be able to manipulate the data it needed to be recorded on a digital spreadsheet. When trying to collect data from a scanned paper document, transferring what is on the page into manipulable digital text is a big challenge. Your saving grace in this Herculean task are programs that “text mine”- using artificial intelligence to read the scanned text for you and transcribe it in plain text into the program you tell it (Word, Excel, etc.). There are various ones, from paid to free and open source. Knowledge of coding is often necessary, mostly to tell the program how to separate lines of text. Keep in mind that there can be a lot of room for error, and you might be disappointed to find the resulting text is littered with problems. Data cleaning is tedious, but it was a necessary part of our classes’ digitization of the 1958 Directory. If the dataset is small enough (hundreds of lines of dozens of pages instead of tens of thousands of lines of hundreds of pages) consider manually typing the lines of info as you read them (which is what I did for the pages I data cleaned). Something which accelerates this task leads to my next point... 4) Two monitors are better than one When you have a task involving cross-referencing (like data cleaning), it can break your train of thought to have to be constantly opening and closing the same two or three tabs. Opening the wrong tab by accident making you forget the short line of info you just memorized can make you grind your teeth. Even a simple action like that can break your flow. So, I’m grateful that the GIS lab has two monitors to a desktop. I find it so much easier to not have to move my hand and simply glance from one fully visible document to another. This also makes it easier to keep up with web tutorials among many other tasks. 5) Google Sheets ...excels your work Both Google Sheets and Excel are great for data organization related to GIS. I made a map using the data from the 1958 Athens City Directory where I showed the locations of the residences of blue collared workers (blue dots) and white collared workers (yellow dots). This was not a distinction made by the directory itself. I took the top 300 occupations listed and categorized them myself using a pivot table to create a new column with a new value. If this option were not available, the task would’ve been too big for me. Knowledge of these two applications helps you work with data more efficiently. I prefer Google Sheets due to how easy it is to apply and use add-on tools from the Google Workspace Marketplace, paired with the ease of sharing the document with others. Offline Excel cannot be edited live by multiple people, and while online Excel documents can- the plugins available for geocoding are more limited and take extra steps to add... Google has SIX paid options: 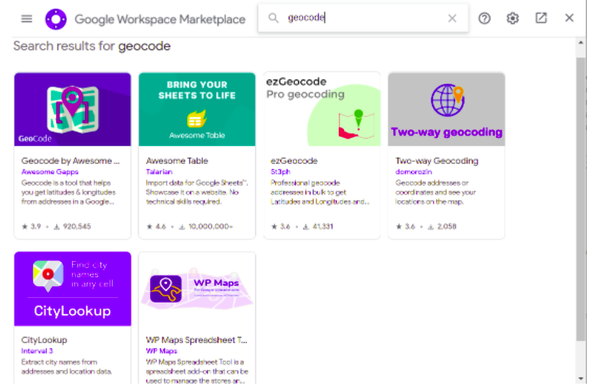 Versus FOUR paid options for Office  Three extra tips? No way!
|
Archives
June 2024
Categories
All
|
 RSS Feed