|
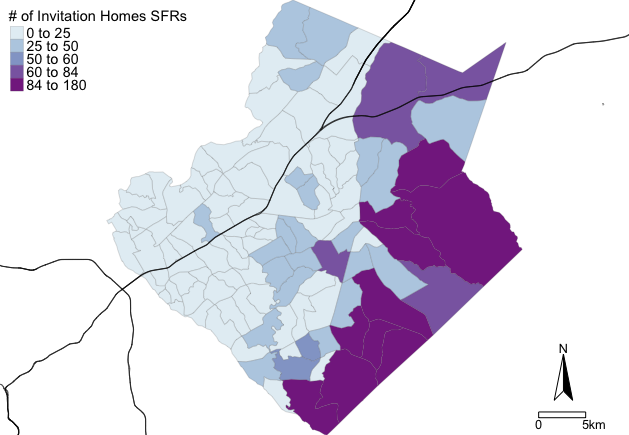
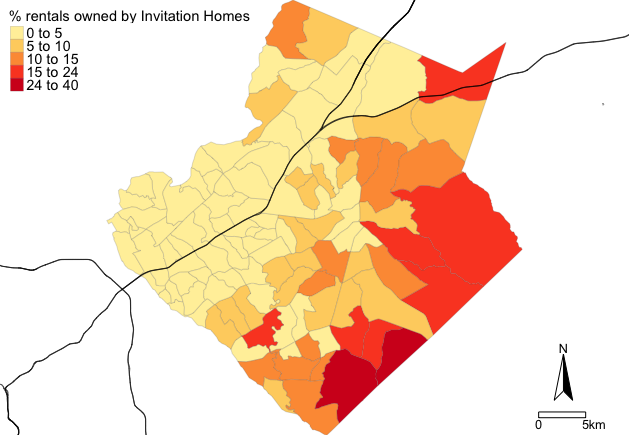
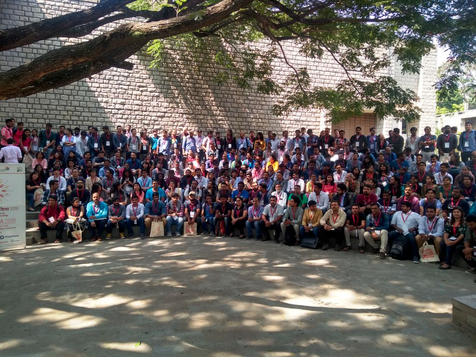
Taylor Hafley We are more than a decade removed from the national foreclosure crisis. Homeownership rates languish near all-time lows. Housing prices have surpassed pre-Recession highs. And a crowd of corporate actors have entered the single-family housing market in the wake of more than 9 million foreclosures during the Great Recession. Yet, there is limited research on the intra-metropolitan geography of large corporate landlords (Raymond and Moore 2016, Abood 2017). In this blog post, I map the geography of one such corporation, Invitation Homes, in Gwinnett County. Specifically, I discuss some of the demographic trends in ten census tracts where Invitation Homes owns more than 1,000 properties. I find these neighborhoods are becoming less white, more Black, and exhibiting a decline in homeownership, offering a few examples of how the Great Recession continues to affect housing markets in suburban Atlanta. Single-family corporate landlords are one example of a broader trend in post-Recession housing markets. The single-family rental (SFR) rate in Atlanta (i.e. the number of single-family homes occupied by renters compared to the total number of occupied single-homes) increased from 11.5% to 19.2% between 2006 and 2016, one of the highest increases among large metropolitan areas (Immergluck, 2018). Immergluck suggests the growth of SFRs may expand the housing options and neighborhoods available to renters in Atlanta. The geographic concentration of land by a single corporation, however, creates problems for jurisdictions at multiple scales and complicates assumptions about who is benefitting from the current housing price recovery. Invitation Homes: What and Where? Invitation Homes is a subsidiary of private equity giant Blackstone. It markets itself as offering quality homes in “desirable neighborhoods across America”. Classified as a single-family Real Estate Investment Trust, Invitation Homes is part of an emergent group of corporate landlords active in the single-family rental market. Invitation Homes owns 12,500 homes in Atlanta – their largest market. They are active in 19 counties in the Atlanta metropolitan area. In this post, I focus on Gwinnett County, where they own more than 3,000 properties. According to Dr. Elora Raymond’s analysis in the popular Atlanta Studies blog, Invitation Homes owned 983 properties in Gwinnett as of 2013 (Raymond and Moore 2016). Thus, Invitation Homes acquired more than 2,000 units between 2013 and 2018. Map 1: Total Invitation Homes' properties by neighborhood Of their more than 3,100 parcels, 1,147 are concentrated in just ten census tracts along the county’s eastern border. In Map 1 above, you can see these neighborhoods near Dacula to the south of Loganville. There are 113 census tracts in Gwinnett County. Meaning, more than 35% of their Gwinnett County portfolio is concentrated in fewer than 10% of the census tracts. Additionally, these tracts contain only 15.5% of the county’s population. Map 2: Invitation Homes rental market share by neighborhood As one attempt to, “uncover stubbornly persistent blind spots in geographic research,” I compare the number of Invitation Homes properties to all occupied rental housing in Map 2. Invitation Homes owns more than one out of five rental units across four contiguous census tracts in the southeast corner of Gwinnett County. The demographic changes happening in these census tracts suggest IH neighborhoods are becoming less white, more Black, and exhibit an above average but declining homeownership rate. Based on data from the U.S. Census’ American Community Survey, the median Black share of the population of these tracts increased nearly ten percentage points from 36.6% to 45% in the past seven years, while the median white share of the population decreased 11.7 percentage points, from 54.3% to 42.6%. Finally, the average homeownership rate declined roughly five points from 85.1% to 79.9%. As a diversifying suburb, these trends aren’t necessarily surprising to anyone familiar with demographic changes in Gwinnett County, but the geographic concentration of land ownership by an institutional investor is a post-Recession reality that impacts communities across the Atlanta metropolitan area, many of which are dealing with a lack of affordable housing. The similar trajectories of demographic change among the IH neighborhoods along Gwinnett County’s eastern edge suggests that the concentration of corporate landlords is an important component in evaluating the post-Recession housing geographies of Atlanta. As a part of my dissertation, I’m thinking about how landlords at this scale can manipulate housing markets, shift demographics, and transform metropolitan spaces (maybe a future post!) References Abood, M. 2017. Securitizing Suburbia: the financialization of single-family rental housing and the need to redefine risk. Massachusetts Institute and Technology. Department of Urban Studies and Planning.. http://hdl.handle.net/1721.1/111349 Immergluck, D. 2018. Renting the Dream. The Rise of Single-Family Rentership in the Sunbelt Metropolis. Housing Policy Debate. DOI: 10.1080/10511482.2018.1460385 Raymond, E. & Zaro-Moore, J. 2016. Financial Innovation, Single Family Rentals, and the Uneven Housing Market Recovery in Atlanta. Atlanta Studies Journal. https://www.atlantastudies.org/single-family-rentals-in-atlanta AuthorTaylor Hafley is a PhD student in the Department of Geography at the University of Georgia. His dissertation focuses on how single-family REITs influence urban-suburban change. Michelle EvansOpenStreetMap (OSM) is an open-source map, an alternative to the ever present Google Map. But it is much more than a data source. OSM is community driven, and its community members host mapathons, participate in FOSS4G and OSGeo activities, and get together to talk about maps, from cartography and aesthetics to the political ramifications of delineating boundaries. These discussions are highlighted at OSM’s State of the Map (SOTM) conferences. State of the Map is the annual, international conference organized by the OpenStreetMap Foundation that brings OSMappers together from across the world. In addition to the international conference one, there are intra-national SOTM conferences that bring mappers within a region together to discuss pertinent regional topics. I had the opportunity to attend the regional SOTM-Asia conference in Bengaluru, India from November 17 -18, 2018. Over 200 people attended the conference, from students and governmental agencies, to NGOs and academics, to more tech-based companies such as Grab and Facebook. There were country representatives from Indonesia, Nepal, Bangladesh, Japan, and the Philippines (and I’m sure many more that I am forgetting!), with a panel highlighting the work happening in each country. The true highlight, however, was seeing the dynamism and diversity of the community. Talks ranged from critical geography to AI-based image recognition, with stimulating conversations at the chai breaks in between. In the US, the OSM community is technologically-driven, with few recognizing the critical geography theory behind their actions or the societal consequences. This mirrors a similar split within the discipline of geography itself (Wilson 2015). And so, it was refreshing to hear discussions on participatory mapping, empowerment, and how to democratize maps and knowledge at what I had expected would be a tech-centered conference. In fact, this was the final message of the opening keynote address, recognizing that open maps aren’t necessarily democratized maps. Historically, maps have been used as a tool of colonization, with the methods to create them and the resulting knowledge only available to a select few. An infamous example of this is the resulting map of the African continent following the Berlin Conference, in which European powers divided the a whole continent into colonies under their control. But we needn’t look to the 1800’s for examples of exclusionary mapping. OSM itself was founded in 2004 in response to the UK’s ordnance survey, a government-run project that created a map of the UK which was not freely available. Since then, OSM encourages “the growth, development and distribution of free geospatial data and [provides] geospatial data for anybody to use and share.” (OSM Wiki) An OSM map is ‘democratized’ in that anyone can contribute to or edit it and the resulting data is free to use for all. Relative to other sources of geospatial data and technologies, this is certainly true. However, we should question who is included in the idea of ‘all’. While the SOTM-Asia conference had a wider diversity of participants than OSM activities in the US, we were all educated, spoke English (in fact, this is a big issue in OSM in Asia in particular, and was brought up by multiple speakers), and boasted a relatively high digital literacy, representing a small portion of the global population. In order to contribute to OSM, one must not only have an internet connection, but also the computer skills to use the editing software. Actually downloading and using the data represents another technological obstacle. The recent development of more open-source, user-friendly software tools has helped reduce this digital divide, but technology still determines who are the mappers and who are the mapped. In this age of rapidly accumulating open data, there is a concurrent call to engage critically with emerging technologies and question how it is changing how knowledge is produced and valued. One session focused on an older ‘technology’, the role of Helavaru storytellers as the archivers and narrators of families’ histories in Karnataka. Helava communities travel with centuries old documents detailing the history of a family and a village, and share the story of a place through a narrative or song (you can see the video from SOTM-Asia here). Following the presentation, a discussion unfolded about how this data could be recorded, and whether computerized technologies such as AI could contribute to an automated process. However, there was push back to this suggestion. What would be lost in the translation of this narrative style into numbers and GPS points? As TB Dinesh said, “Maps are denotational, but storytelling is connotational.” Whose knowledge is this and who has a right to capture and/or disseminate it? And perhaps more importantly, what would this mean for the Helava community if the records become digitized, and telling stories is no longer sustainable? I spent a large portion of the conference wrestling with these questions and, based on my discussions with others, I was not alone. Like other FOSS communities, OSM aims to democratize data and the tools to create and analyze the data. ‘Open’, as discussed above, can be a relative term, and ‘putting people on the map’, so to speak, is not always in their best interest if they are not involved in the process or have access to the data that is created. OSM and other open GIS systems, particularly Humanitarian OpenStreetMap (HOTOSM), are often critiqued for a reliance on remote mapping (Palmer 2012), whereby those in the Global North map out the Global South, meeting Pickles’ prediction of a ‘new imperial geography’ (Ground Truth, 1994). OSM chapters and contributors in Asia are working against this critique through their use of participatory mapping and field-based projects. However, even within a chapter, inequality exists, particularly around gender. OSM has a reputation for being dominated by men, which translates into maps that are not representative of everyone’s landscape. During the SOTM Asia country panel, this issue was brought up, and OSM chapters are working hard to ensure their meetings and mapathons are safe spaces for women and others. In fact, this reputation may be changing. As OSM chapters are moving from simply documenting the world to responding to natural disaster crisis and creating data specifically to address social injustices, new members are getting involved. Programs such as Youth Mappers and Let Girls Map are working to improve inclusivity in the OSM community, and show those working in social justice and advocacy how OSM can be a tool for change. OSM’s creation caused a radical shift in mapping, opening up control of the map to a much wider audience than had previously been allowed. Over a decade after its creation, however, the community is reflecting on just how ‘democratized’ open data is. I’m optimistic that a combination of FOSS-based tools and community-driven critique and discussion, such as took place at SOTM-Asia this year, will continue to expand our notion of ‘all’ in the effort to democratize the map. Note: In addition to these more theoretical discussions, there were also some workshops on cutting edge software and tools and presentations highlighting innovative applications of OSM to a range of societal issues. Once the slides and videos are made available, I will post a link to them here, and I highly recommend checking them out. AuthorMichelle Evans is a PhD student in the Integrative Conservation and Ecology program at the University of Georgia. Her research explores the ecological, social, and political drivers of spatial inequalities in mosquito-borne disease burdens. |
Archives
June 2024
Categories
All
|


 RSS Feed