|
By Dy'Amond Mcghee, CML CURO student
The COVID-19 pandemic has increased the number of people at risk for eviction. Since January 2021, Georgia’s rent prices have increased by 22% per year, making Georgia the sixth highest rent increase in the U.S (United States) [1]. In Athens-Clarke County, we believe that there is inadequate data on the number of evictions that have occurred during the COVID-19 pandemic. The number of evictions in Athens-Clarke County is estimated to be higher than people would believe due to the COVID-19 pandemic. With no eviction data collection or research, a lot of residents cannot take advantage of several COVID-19 emergency relief rental assistance programs. If we can prove that there is a large number of people being evicted in the Athens-Clarke County area, then more people could get rental assistance and help from government programs. The Community Mapping Lab is currently working with community-based partners such as the Athens-Clarke County Magistrate court, to collect and visualize important data on the progression of evictions and levels of housing insecurity in Athens. While working with the Magistrate court we are able to go to the Magistrate court office once a week and scan up to 50 ACC eviction files per week. With this data we will be able to enter specific information from the file into a spreadsheet and an ArcGIS dashboard to see where and why people in ACC are getting evicted. Are people getting evicted for rent increases, loss of a job, or waiting on the GRA program? For scanning the eviction files at the courthouse, we used the CZUR Shine Pro scanner. The scanner attaches to a laptop with a USB cord and has a foot petal attached to the scanner. This instant scanner allows us to scan an average completed eviction file in minutes. After scanning the eviction files, we enter the necessary data into a spreadsheet. The spreadsheet includes the case number, the property owner, the tenant's name, code name, the date the case was filed, and the result of the case. We take the data for each case in the spreadsheet, and then enter more data into the ArcGIS dashboard. ArcGIS is a cloud-based mapping software that allows us to make maps, analyze data, and share our findings. Some additional information that we input in the ArcGIS dashboard is a code name for the tenant, the location of the rental property, the reason for the eviction case, the action taken by the tenant, the court date of the case, and the results of the case. Over the last ten weeks of working with the Athens Eviction Mapping project, I have found several interesting trends on evictions in ACC. First, the majority of the cases that were filled from January 2022 - February 2022 did not have an end result, meaning that we are unable to know if the tenant was officially evicted or if the voluntary vacated the premises. The second trend I found was that tenants that applied for the GRA program were sent a warrant to be evicted from their unit within a month or two of nonpayment. I realized that the GRA program is taking a long time to get back to tenants and rental properties on if they will grant assistance to a tenant or not. Lastly, I have seen a trend that people that were evicted in the beginning of 2021 were typically evicted from the same few apartment properties. If we continue with this eviction mapping project, we could find out why people are being eviction so much from these several apartments and try to get these tenants more help. The data that we have collected so far concludes that Athens-Clarke County does have a high eviction rate and that citizens here do indeed need funding for rental assistance from the State. References: [1] Raymond, Jonathan. 2021. “Rent Increases in Georgia This Year Were Sixth-Highest in the Country, According to Study.” 11Alive.
0 Comments
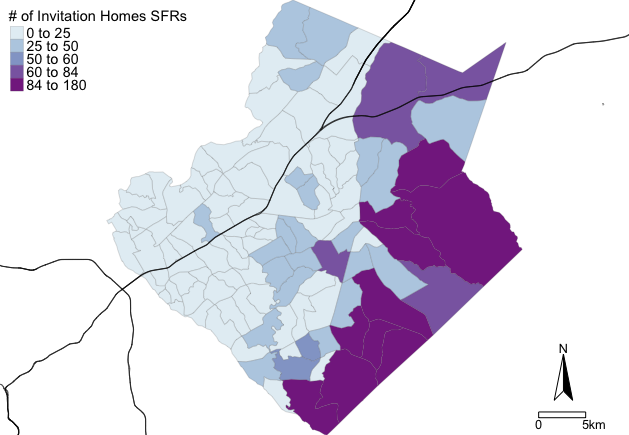
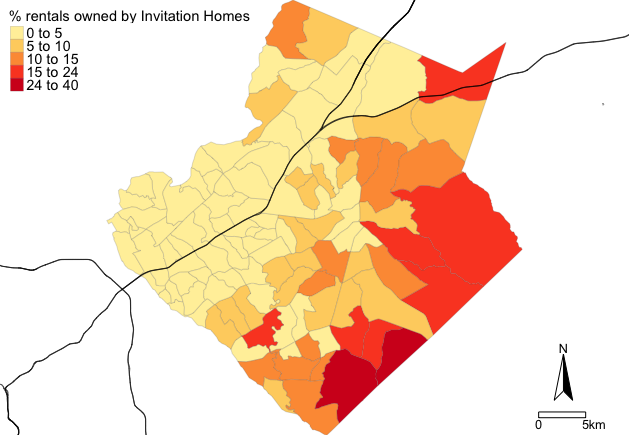
Taylor Hafley We are more than a decade removed from the national foreclosure crisis. Homeownership rates languish near all-time lows. Housing prices have surpassed pre-Recession highs. And a crowd of corporate actors have entered the single-family housing market in the wake of more than 9 million foreclosures during the Great Recession. Yet, there is limited research on the intra-metropolitan geography of large corporate landlords (Raymond and Moore 2016, Abood 2017). In this blog post, I map the geography of one such corporation, Invitation Homes, in Gwinnett County. Specifically, I discuss some of the demographic trends in ten census tracts where Invitation Homes owns more than 1,000 properties. I find these neighborhoods are becoming less white, more Black, and exhibiting a decline in homeownership, offering a few examples of how the Great Recession continues to affect housing markets in suburban Atlanta. Single-family corporate landlords are one example of a broader trend in post-Recession housing markets. The single-family rental (SFR) rate in Atlanta (i.e. the number of single-family homes occupied by renters compared to the total number of occupied single-homes) increased from 11.5% to 19.2% between 2006 and 2016, one of the highest increases among large metropolitan areas (Immergluck, 2018). Immergluck suggests the growth of SFRs may expand the housing options and neighborhoods available to renters in Atlanta. The geographic concentration of land by a single corporation, however, creates problems for jurisdictions at multiple scales and complicates assumptions about who is benefitting from the current housing price recovery. Invitation Homes: What and Where? Invitation Homes is a subsidiary of private equity giant Blackstone. It markets itself as offering quality homes in “desirable neighborhoods across America”. Classified as a single-family Real Estate Investment Trust, Invitation Homes is part of an emergent group of corporate landlords active in the single-family rental market. Invitation Homes owns 12,500 homes in Atlanta – their largest market. They are active in 19 counties in the Atlanta metropolitan area. In this post, I focus on Gwinnett County, where they own more than 3,000 properties. According to Dr. Elora Raymond’s analysis in the popular Atlanta Studies blog, Invitation Homes owned 983 properties in Gwinnett as of 2013 (Raymond and Moore 2016). Thus, Invitation Homes acquired more than 2,000 units between 2013 and 2018. Map 1: Total Invitation Homes' properties by neighborhood Of their more than 3,100 parcels, 1,147 are concentrated in just ten census tracts along the county’s eastern border. In Map 1 above, you can see these neighborhoods near Dacula to the south of Loganville. There are 113 census tracts in Gwinnett County. Meaning, more than 35% of their Gwinnett County portfolio is concentrated in fewer than 10% of the census tracts. Additionally, these tracts contain only 15.5% of the county’s population. Map 2: Invitation Homes rental market share by neighborhood As one attempt to, “uncover stubbornly persistent blind spots in geographic research,” I compare the number of Invitation Homes properties to all occupied rental housing in Map 2. Invitation Homes owns more than one out of five rental units across four contiguous census tracts in the southeast corner of Gwinnett County. The demographic changes happening in these census tracts suggest IH neighborhoods are becoming less white, more Black, and exhibit an above average but declining homeownership rate. Based on data from the U.S. Census’ American Community Survey, the median Black share of the population of these tracts increased nearly ten percentage points from 36.6% to 45% in the past seven years, while the median white share of the population decreased 11.7 percentage points, from 54.3% to 42.6%. Finally, the average homeownership rate declined roughly five points from 85.1% to 79.9%. As a diversifying suburb, these trends aren’t necessarily surprising to anyone familiar with demographic changes in Gwinnett County, but the geographic concentration of land ownership by an institutional investor is a post-Recession reality that impacts communities across the Atlanta metropolitan area, many of which are dealing with a lack of affordable housing. The similar trajectories of demographic change among the IH neighborhoods along Gwinnett County’s eastern edge suggests that the concentration of corporate landlords is an important component in evaluating the post-Recession housing geographies of Atlanta. As a part of my dissertation, I’m thinking about how landlords at this scale can manipulate housing markets, shift demographics, and transform metropolitan spaces (maybe a future post!) References Abood, M. 2017. Securitizing Suburbia: the financialization of single-family rental housing and the need to redefine risk. Massachusetts Institute and Technology. Department of Urban Studies and Planning.. http://hdl.handle.net/1721.1/111349 Immergluck, D. 2018. Renting the Dream. The Rise of Single-Family Rentership in the Sunbelt Metropolis. Housing Policy Debate. DOI: 10.1080/10511482.2018.1460385 Raymond, E. & Zaro-Moore, J. 2016. Financial Innovation, Single Family Rentals, and the Uneven Housing Market Recovery in Atlanta. Atlanta Studies Journal. https://www.atlantastudies.org/single-family-rentals-in-atlanta AuthorTaylor Hafley is a PhD student in the Department of Geography at the University of Georgia. His dissertation focuses on how single-family REITs influence urban-suburban change. |
Archives
June 2024
Categories
All
|


 RSS Feed