
|
By Claudia White Community GIS student and CML research assistant, Spring 2022 This semester, I am taking Community GIS with Dr. Shannon and working with the Community Mapping Lab on various projects, including creating a StoryMap of Linnentown (a Black residential community in Athens displaced by urban removal in the 1960s), digitizing a street network, geocoding addresses, and cleaning data records from a 1958 Athens directory. One of our assignments was to create a map using the 1958 Athens directory and the street network that we digitized. The city directory included a listing of residents, businesses, and organizations in 1958 and their addresses. Data on residents included several variables, such as occupation, race, the number of dependents, home ownership status. Using the address data and resident data, I decided to create a map about the commute time of maids to look at patterns of travel (time, length, etc.) clustering of living vs working addresses. The current map is hosted on ArcGIS Online, but I first tried to make it in ArcGIS Pro. Here be the practical things I have learned while making this map. 1) Creating Maps for the Public There are a million tiny decisions to make when creating maps from scratch. Creating visualizations for yourself is one thing, but creating maps for the general public is another. When creating maps for others, make sure you are creating visuals that are both easy to understand and easy to look at. Keeping design principles in mind is key. My first map draft had colors that were difficult to distinguish, lines that were hard to separate from the background streets, and symbols that were too small to see (Figure 1).  Figure 1 With Dr. Shannon’s help, I thought about figure-ground, visual contrast, and legibility. To make the map easier to read, I made the background road network more transparent, set route colors to very contrasting colors and put a drop shadow on the routes to make them more discernible from each other and the background. I also made the symbols larger so they were more visible. I then made each maid’s route, living, and working address the same color, so that the viewer could easily see which route and addresses corresponded with each maid (Figure 2).  Figure 2 2) ArcGIS Pro a) Use snap when digitizing in ArcGIS Pro. Digitizing images in any GIS software can be tedious, but if you are using ArcGIS to turn an image into features. I highly recommend using the “snap” setting. Turning on snap allows you to minimize topological errors as you digitize (making sure your lines meet up and your polygons are closed. This setting was very helpful when digitizing the 1955 street network for Athens. It made sure that I only created lines that connected to a point on another existing street line. You can turn the snap setting on and off through the dashboard. b) Depots are origins and orders are destinations. When creating a driving route in ArcGIS Pro using street networks, you can use the Make Vehicle Routing Problem Analysis Layer. This function will only create a network analysis layer. After creating the layer, you then have to input points that you want to be used to create routes within the network analysis layer. When using sets of origin and destination points (ex: if you want to calculate your commute from your home address to your working address), it is important to note that “depots” are origin points and “orders” are destination points. c) You can create tiles from raster data using the Create Map Tile Package. This function uses data from a map pane and compresses it into a tile package that can be used in ArcGIS Online. Make sure the only data on your map pane is the data that you want to tile. Before using this function, you have to add a description, summary, and tags to the data that you are tiling. You must then input the corresponding summary and tags into the geoprocessing pane for the Create Map Tile Package function. d) You can share map layers as Web Layers for ArcGIS Online. If you right click on a layer in your map, you can share that layer as an online web layer that can be used in ArcGIS Online. This tool can be used on raster and vector data. You must add a summary and tag(s) of the layer. Once you share the layer as a web layer, the layer is automatically uploaded to your ArcGIS Online content and can be opened, viewed, and stylized in ArcGIS Online. This is particularly useful if you have styled a layer in a particular way because it maintains the layer’s symbology. 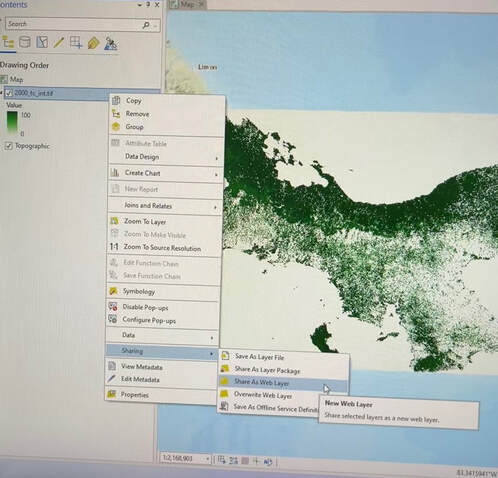 Figure 3 3) ArcGIS Online
a) Map Viewer Classic is picky about data users can upload. When using ArcGIS Online to create a map based on the 1958 Athens directory for this class, I learned that ArcGIS online only accepts certain types of data. In Map Viewer Classic, users can only upload a zipped shapefile, CSV or TXT files, GPX, or GEOJSON files from their files. Of course, users can also use data that is hosted by ArcGIS Online, but the types of data the user can add and manipulate is limited. b) Map Viewer Classic vs New Map Viewer: Uploading data In Map Viewer Classic, users are able to add data directly from a file. In the new Map Viewer, users have to jump through a couple more hoops. When using the new viewer, users must first upload their data from file to their content page in ArcGIS Online. When uploading data, you should check the box that adds the desired file AND creates a hosted feature layer. This ensures that you will be able to easily add uploaded data to the map viewer. c) It does not like raster data. ArcGIS Online is not a fan of raster data and is not compatible with tiff files. If you are using raster data, first look for any datasets that are already hosted on ArcGIS Online that display the information you are looking for. If you can’t find desired data and must upload an original raster dataset, the best way to do this is by converting your raster data set to tiles and then uploading the tiles to ArcGIS Online. Final thoughts In creating this map, I learned technical skills related to using different analysis toolboxes in ArcGIS Pro. I also learned how to navigate bounds of ArcGIS online. Most importantly I learned what factors to consider when creating maps for a public audience, including color contrast, symbology, and clear labeling. These skills will help me create more accessible and intuitive visualizations in the future.
0 Comments
Leave a Reply. |
Archives
June 2024
Categories
All
|
 RSS Feed