|
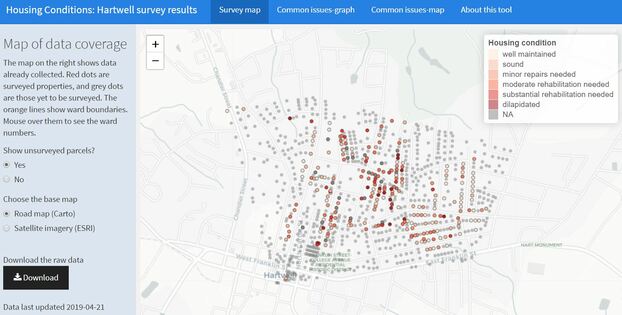
Jerry Shannon A few weeks ago, I and roughly 8,000 other geographers attended the annual American Association of Geographers (AAG) meeting in Washington, D.C. While it can be exhausting--AAG has dozens of sessions going on at any given time--these meetings are a great chance to see friends and colleagues and meet new folks whose work I’ve only read or who I’ve only met online. (Despite the platform’s very real problems, I personally have benefited a lot from participating in #academictwitter). One moment that stuck out: I was talking with Peter Johnson, a faculty member at the University of Waterloo, a morning reception hosted by the Digital Geographies Specialty Group. Peter does great work with open data and governance. For example, here’s one of his recent articles on the costs of open data, including the ways it subsidizes private enterprise and corporate influence on policy. Over the last decade, there’s been a strong push for open data initiatives across multiple levels, from cities up through international bodies such as the UN, which makes this work particularly salient. Companies such as ESRI and Socrata have created platforms for hosting and sharing these datasets, and the rhetoric around these tools emphasizes transparency and community engagement. Socrata’s page, for example, references a goal of “fully connected communities,” while ESRI touts its “two way engagement platform.” In my classes, I’m particularly fond of letting students analyze NYCOpenData’s records of yellow cab taxi trips, including more than 100 million trips with details down to the tip given for each one. Peter’s work, along with many others including Renee Sieber, Muki Haklay, Rina Ghose, Taylor Shelton, and Rob Kitchin, has examined how these projects play out on the ground, focusing on whether they live up to claims of citizen engagement and empowerment. As one might expect, results have been mixed. The people most likely to use these data are the ones with the education, training, and expertise to do so--a fairly select group. In my Community GIS class, I use this article on Data Driven Detroit as one example of this dynamic, where open data records on housing only strengthened investors’ ability to buy up vacant property. The alternative model presented in that article is one I’ve been thinking through as well, community-based projects that facilitate residents’ ability to interact with and make meaning from public data. I asked Peter about this dynamic in our conversation, and he mentioned a project conducted by the Canadian government where trained staff would work with remote rural and indigenous communities, helping them interpret census and other government data and understand their relevance to local concerns. In recent years, the Canadian government has increased the online availability of these data, but it has cut the number of trained staff who can work with local communities. In effect, open data portals replaced these staff, providing more “access” to data but curtailing the work needed to understand and interpret it. Recent developments in both open source and proprietary software have provided a number of tools for community-based data collection and open data for government records. But, as Alex Orenstein said at our recent community geography workshop, you also need to “check yourself before you tech yourself.” These platforms provide interfaces for accessing and visualizing these data, but they cannot fully replace the important work of helping community members articulate how the data may (or may not) match their own experience. I’ve been thinking about this in light of my now years-long work with Georgia communities through the Georgia Initiative for Community Housing. Along with my colleague Kim Skobba, I have been helping develop a toolkit for community-based housing assessments, one that uses free and open source software such as OpenDataKit and RStudio’s Shiny platform. These technological tools make it possible for even small rural communities to collect and map out detailed data on individual housing conditions, identifying common issues and facilitating outreach to specific property owners. At the same time, communities struggle with what to do with these data once it’s collected beyond simply noting patterns on the map. Similar to Taylor Shelton’s work in Lexington, I’ve been thinking about ways to work with communities to visualize drivers of problems identified through these data. By talking about landlords, zoning, and other historical factors, we can beging to talk about the problematic history of blight as a metric and its ramifications for community development. This isn’t work that can be solved by a platform or visualization software. It involves time and “soft skills”--listening, thinking, reading, and many conversations, before the work of data collection even gets started. Community members themselves often want to jump right into the technology, and so it is sometimes difficult to communicate the need to move more deliberately. This is hard labor, but as folks working in public participatory GIS (PPGIS) have long emphasized, it’s crucial to fostering sustainable, just change in communities.
Author Jerry Shannon is an Assistant Professor at the University of Georgia in the Departments of Geography and Financial Planning, Housing, & Consumer Economics. He is the director of the Community Mapping Lab. Comments are closed.
|
Archives
June 2024
Categories
All
|


 RSS Feed