|
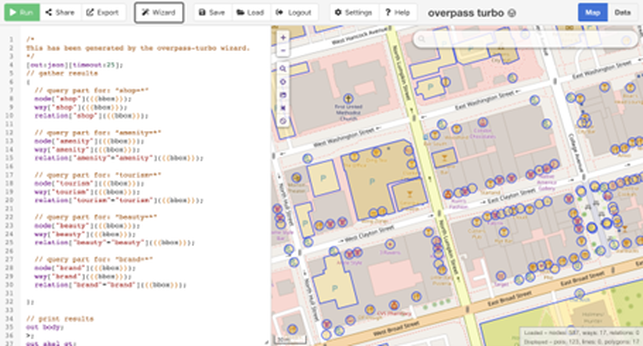
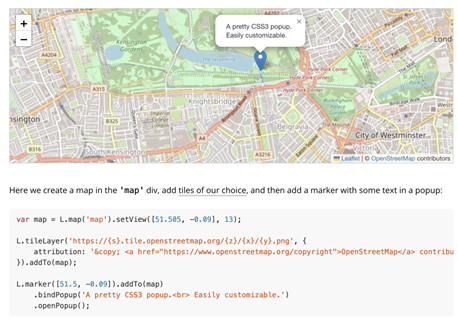
By Nemin Wu, Student in Community GIS, Spring 2022 Imagine that you had to create an interactive map of points of interest (POI). What if that map had to have pop-up windows to display all the essential information? Where to find the base map? How to get the precise coordinates of the potential POI? What codes control the zoom-in and zoom-out functions of the map? How to publish the web map? If you’ve never had any open GIS experience, these may be all tricky problems. However, with open-source, you may be surprised to find that all the data and techniques are more transparent and accessible to the average audience than you thought. Towards the end of the semester, we started our final project in the Community GIS class: mapping businesses in the Unite Against Discrimination Movement (UADM) list in downtown Athens. Our goal is to update the list of businesses of the United Against Discrimination campaign and create an interactive map showing these businesses on the Athens Anti-Discrimination Movement (AADM) website. In this project, we leverage the power of data and techniques from lots of open sources such as OpenStreetMap, QGIS, Leaflet, and GitHub). OpenStreetMap To update the AADM’s business sites through field canvassing and confirm all these businesses are displaying AADM’s list sticker in their windows, the primary step is to get the locations of the relevant businesses. OpenStreetMap, as the name suggests, is a collaborative open geographic data source. Since it’s not owned by anyone, there are no legal restrictions on its use. Everyone has permission to download and employ the latest data of their research area. Fig.1 shows the codes we used to search for business sites in downtown Athens. The queries may be a little bit confusing to read, and you might be concerned about how to code these. However, the truth is that we didn't type a single line of code manually, because they were all generated automatically through the wizard window. Editing the data in OSM is also incredibly user-friendly. After the field canvassing, we updated the OSM map since some stores have moved (Fig. 2a, Eye Candy moved to the South Milledge) and others were not previously displayed on the map (Fig. 2a, Rook and Pawn is newly added to the map). Once you are satisfied with your changes on the OSM website, you can upload them to the servers, and the map will be updated. It’s also very convenient for the users to check the editors and the version history on the history tab. In this way, OSM offers the public to draw the features efficiently and accurately on its map. QGIS Similar to the OSM, QGIS is not owned by anyone, so it won’t hold people back from using them in creative, productive ways like other GIS closed source software. In this project, we used the QuickMapServices plugin to find the appropriate base maps, we employed the QuickOSM plugin to import OSM data based on the Overpass API, and we installed the qgis2web plugin to generate web maps based on Leaflet from current projects. All the codes of QGIS are accessible on GitHub. In addition, free access is also very attractive for researchers with tight budgets. Leaflet At the end of the project, we needed to generate a web map of all the businesses listed on the AADM’s list. To get around this, we chose the open-source JavaScript library, “Leaflet,” to generate the interactive maps. It has tons of interactive mapping functionalities. Fig. 3 shows the readability and simplicity of the source codes in Leaflet. It also provides lots of base maps choices on the Leaflet Provider website. I used to be a little biased, assuming that open-source databases and services might be difficult to use and maintain because they are accessible to everyone. I had heard of and downloaded OSM data many times, but I had never tried editing it prior to this class. This project opens my eyes to open-source data and methods. The fact turns out that the "difficult registration, uploading, and updating process" that I had assumed took me only less than a minute. I realize open GIS has great potentials to foster collaboration and innovation; QGIS provides the same or even more flexible methods of publishing web maps as ArcGIS Pro. There are diverse open-source plugins available that provide great solutions to your problems. For example, we wanted to change the symbology of the points in AADM’s list and we discovered the SimpleSvg plugin written by other community members that supports for SVG icons; The Leaflet tutorials provides significant flexibility on the choices of base maps and the marker.
This also reminds me of the previous readings Being a ‘citizen’ in the smart city (Cardullo et al. 2018) and Citizen Science (Haklay 2013) because people show different levels of participation while using or contributing to the open GIScience, some participates in data collection(e.g., updating the features on OSM), some engage in the problem definition (e.g., posting thoughts/ issues in the QGIS repository on GitHub, some provides interpretation or solutions (e.g., pull requests/ upload plugins). As the article Opening GIScience: A process-based approach (Shannon 2018) says, there are some tensions and tradeoffs in open GIScience: between standardized and flexible tools, between expert driven and community driven designs; between single and multiple audiences; between established and emerging metrics. However, whether you're an enterprise systems integrator, a GISer wishing to share any geographic information, or a user looking to engage with others, open GIS provides a variety of options for getting your work done efficiently and effectively.
0 Comments
Leave a Reply. |
Archives
June 2024
Categories
All
|


 RSS Feed