|
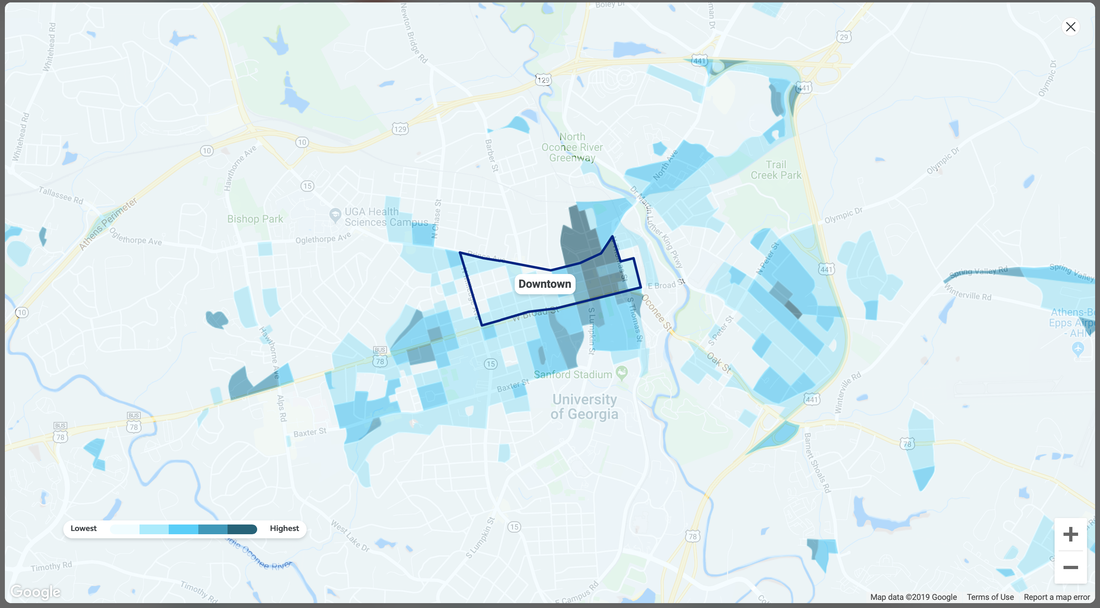
Taylor Hafley I’ve spent the past year working for a unit on campus that connects university resources to rural communities throughout the state. Overall, the work is enjoyable, refreshing, and informative. I get to apply GIS skills to a range of projects for organizations in small towns on issues they’ve identified as important but lack the resources to complete. One of my latest projects was analyzing crime data in Pierpoint, Georgia (editors note: Pierpoint, GA is a pseudonym). The project began as a local economic development tool to show that in fact, this community was not a place with significant numbers of violent crime, but in the end it altered the policing routes. This unanticipated uptake of my analysis has left me wrestling with what success might look like using GIS to map crimes? And what is failure? In this blog post, I share some of my reflections from the experience and outline some of the challenges unique to doing this work in rural communities. Given the well-documented connections among race, crime, policing, and GIS, this project made me a little nervous from the start, however, policing was not the impetus for the project. Pierpoint’s motivation for the project was that a business informed city leaders the town’s ‘high crime rate’ was among the reasons they didn’t locate to their community. In Pierpoint, negative web-based crime ratings (from places like Trulia or Area Vibes) were leading businesses to seek other areas entirely and having real economic implications. Debunking one of these online ‘sources’ for crime analysis was an exciting proposition to me.  Trulia's crime 'hot spots' in Athens, GA, home of the Community Mapping Lab According to one website, Pierpoint was a place of violent crime, with murder rates more than double the state of Georgia and the national average. Surprising to me, the rate was accurate, but there was a small numbers problem: the town had two murders in the past three years. This points to a broader issue, namely that data analysis in rural communities has multiple challenges not present in large metros. One, census data is ill suited for small areas. The county has less than 20 census tracts. The municipality, my focus, consists of only five census tracts--three of which extend beyond the jurisdictional boundary. And, most of the ACS demographic data at the neighborhood level has 10-30 percent margins of error, meaning calculating rates or doing any sort of areal interpolation is fraught with accuracy issues. Second, small rural communities are short staffed and under-resourced following decades of state funding roll backs and market-based municipal governance. When a project like this comes from local leaders, a new task is heaped on an already overworked employee who must pull together three years of data for a project they know little about. This means that data quality, communication, and feedback are often inconsistent. Lastly, these projects are full of competing power relations to work through. As the ‘technical expert’ from the land grant university, I noticed employees often deferred to me even when I tried to glean insight from their local expertise and sought their feedback on drafts of the report. At the same time, I am not an autonomous actor. My grad student assistantship hinges on completing projects identified by the communities I work with. In the end, I provided a report to the police department showing the spatial trends of crime types over the past three years. I found out a few months after I submitted the report that the department made changes to their officers’ routes as a result of my analysis. This was not a suggestion I made or the initial motivation for the project. Yet, my work informed this decision. In this way, I failed to one, consider the power of maps and visualizations once they are floating around in public; and two, account for the existing biases and assumptions members of the community might bring to the data I shared. The project began as a local economic development tool to show that in fact, Pierpoint was not a place with significant numbers of violent crime, but in the end it was simply used as a way to better target law enforcement efforts, perhaps putting already vulnerable communities at further risk. In other words, the impetus to demonstrate that Pierpoint was not a place of violent crime potentially added to the structural violence marginalized groups face. In this way, counter mapping efforts such as Million Dollar Blocks offer an important dimension to crime analysis. My experience in Pierpoint has challenged me to find ways to build stronger relationships with the communities before I hand over data and consider a project complete. I will also use more caution when I present to community groups in future projects. In a more general sense, I’m curious about how I can meet community-driven project goals but also enfuse critical perspectives, and in particular, how I can better teach critical cartography ‘on the fly’. I welcome feedback from others engaged in similar work and wrestling with similar questions. Author
Taylor Hafley is a PhD Student in the Department of Geography at the University of Georgia.
0 Comments
Leave a Reply. |
Archives
June 2024
Categories
All
|

 RSS Feed